Public domain photos
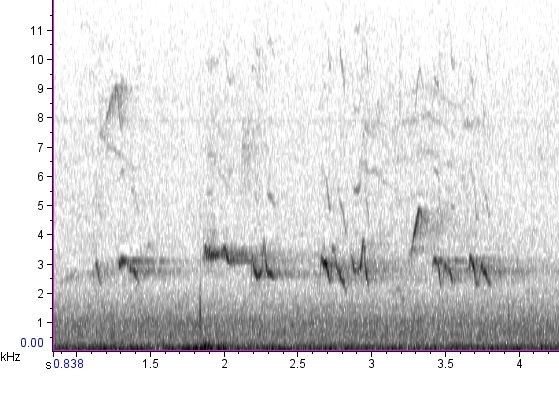
The image shows a black and white plot of a waveform with a line graph in the center. The graph is composed of a series of lines and numbers, indicating the frequency of the waveform.
 Open in library
Public domain photos
Open in library