The image shows a computer screen with a variety of different types of heat maps, each with a different color and text.
Read full description
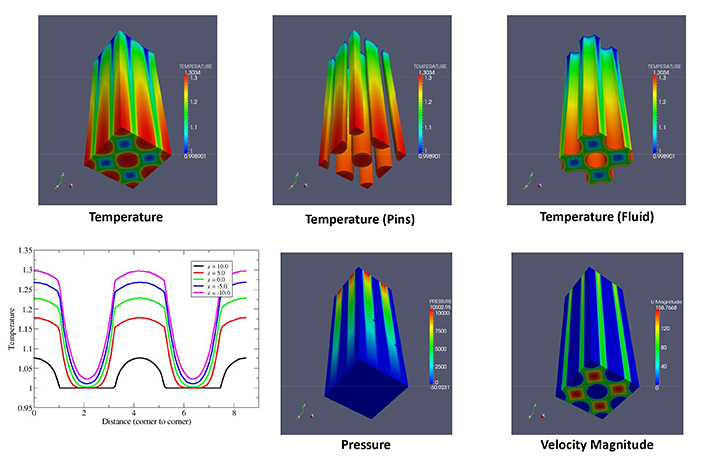
The image shows a computer screen with a variety of different types of heat maps, each with a different color and text. The heat maps are used to measure the temperature, pressure, and velocity of an object, providing a visual representation of the different properties of the object.