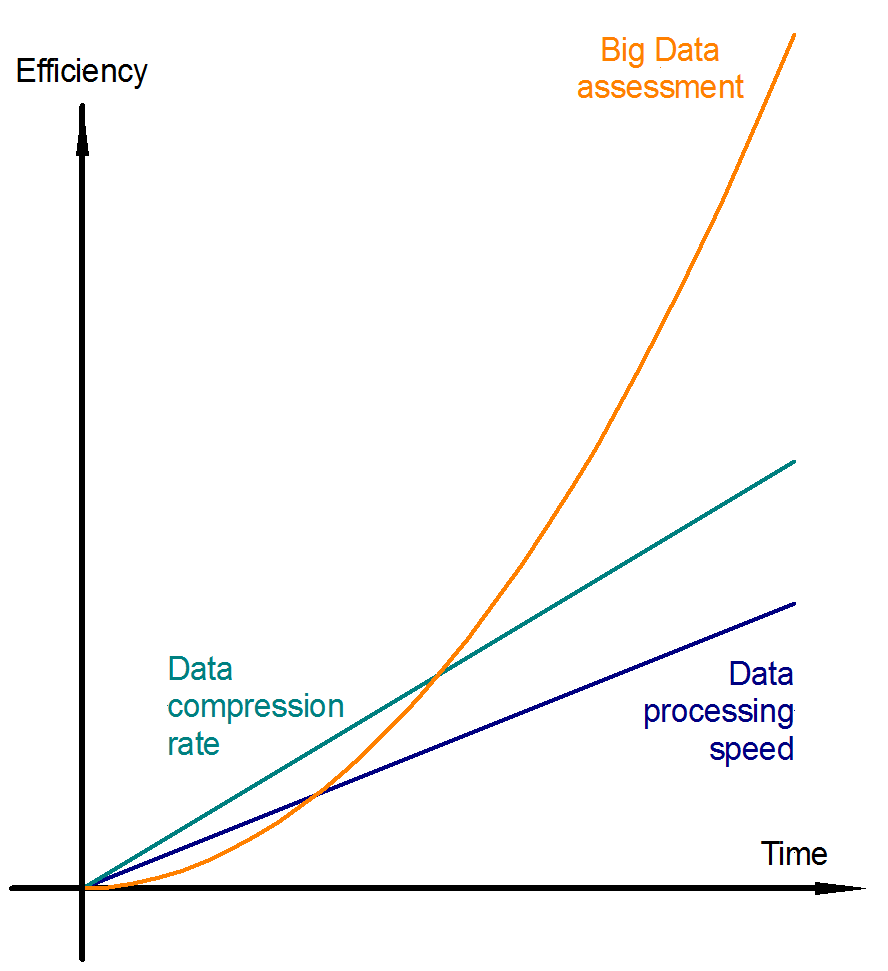
The image shows a graph depicting the efficiency and data processing speed of a big data assessment.
Read full description
The image shows a graph depicting the efficiency and data processing speed of a big data assessment. The graph is composed of two lines, one labeled "efficiency" and the other labeled "data processing speed". The x-axis of the graph is labeled "Time" and is colored blue, while the y-axis is colored green. The two lines intersect at the top and bottom of the image, indicating the relationship between the two variables.