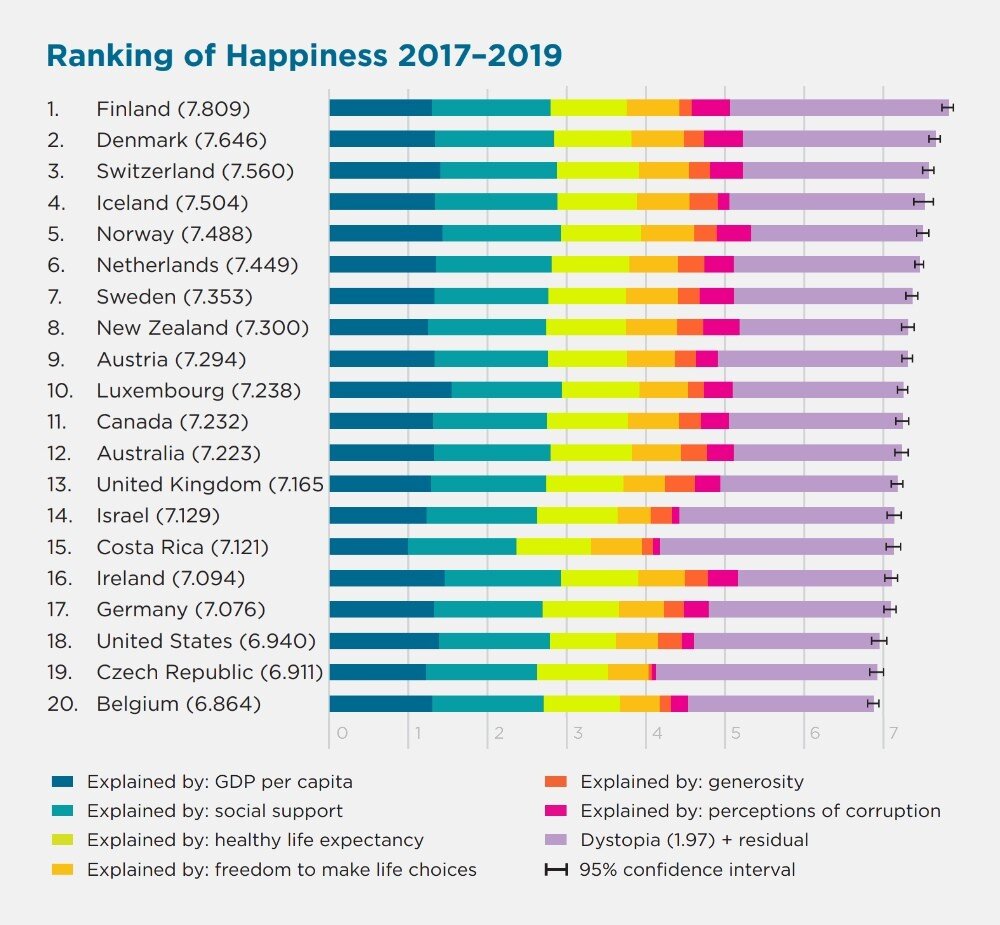
The image shows a bar chart depicting the ranking of happiness in 2017-2019.
Read full description
The image shows a bar chart depicting the ranking of happiness in 2017-2019. The chart is composed of several bars of varying heights, each representing a different year, with the height of each bar indicating the number of people who have been diagnosed with cancer. The text accompanying the chart provides further information about the data, such as the percentage of people diagnosed with the disease and the total number of deaths.