Read full description
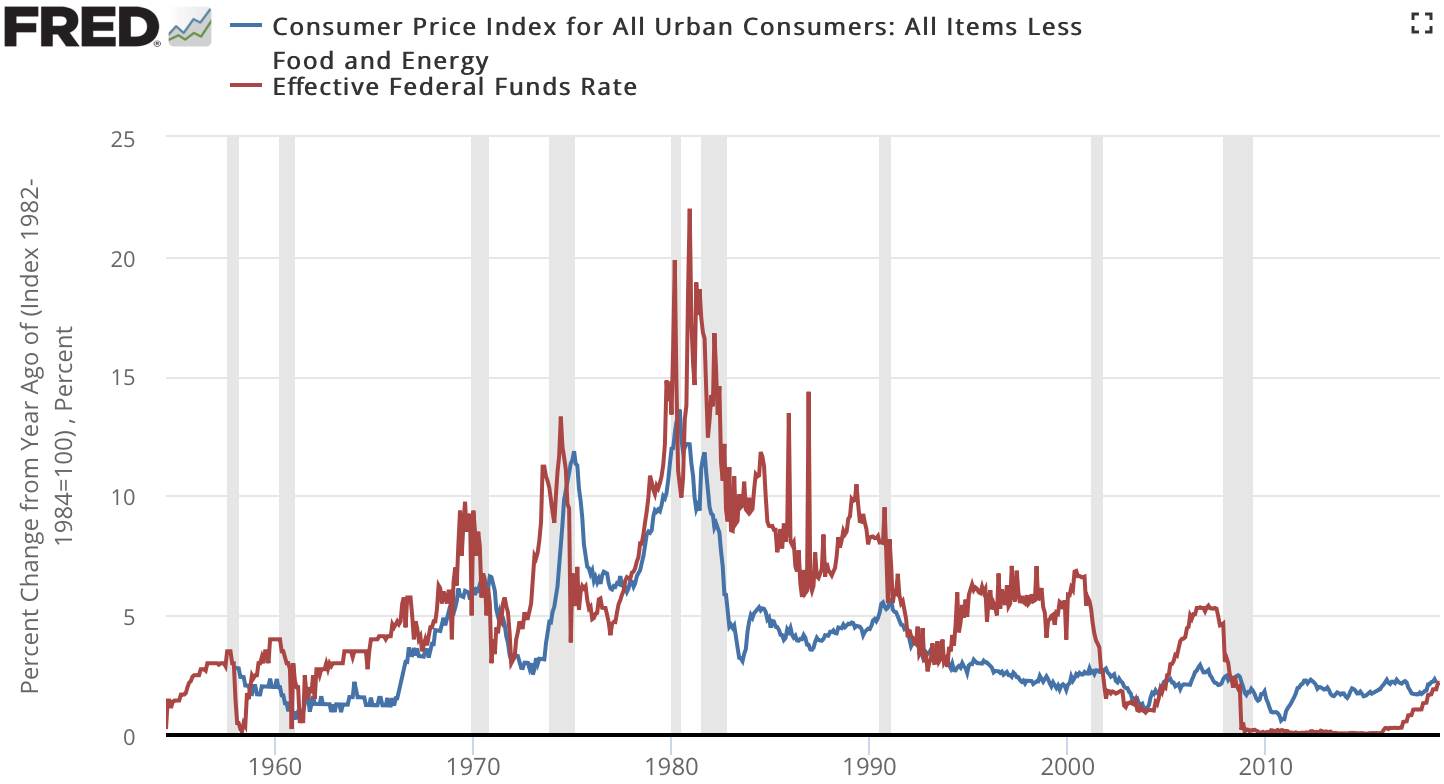
The image shows a graph on a white background with text that reads "consumer price index for all urban consumers all items less food and energy effective federal funds rate". The graph displays the consumer price index over a period of time, with the x-axis representing the years and the y-axis indicating the rate of inflation.