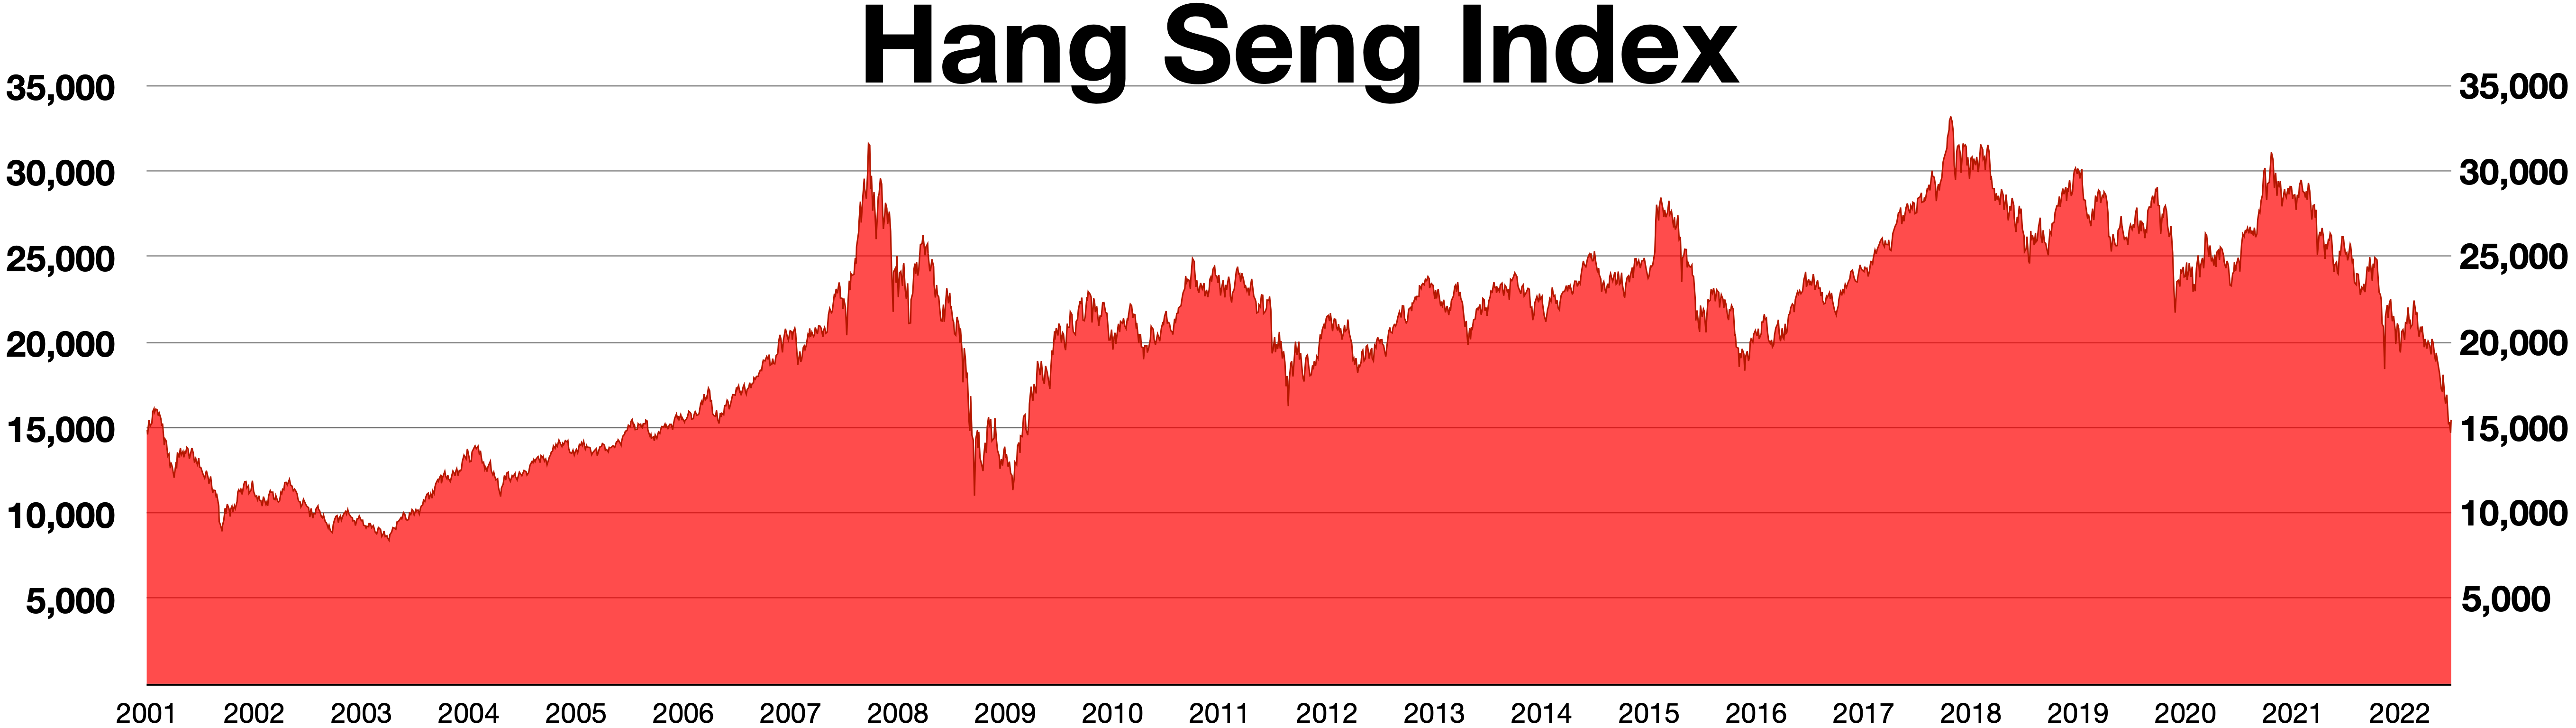
The image shows a red graph with the words "hang seng index" written at the top.
Read full description
The image shows a red graph with the words "hang seng index" written at the top. The graph displays the index over a period of time, with the x-axis representing the days of the week and the y-axis indicating the index. The red color of the graph stands out against the white background, making it easy to read.