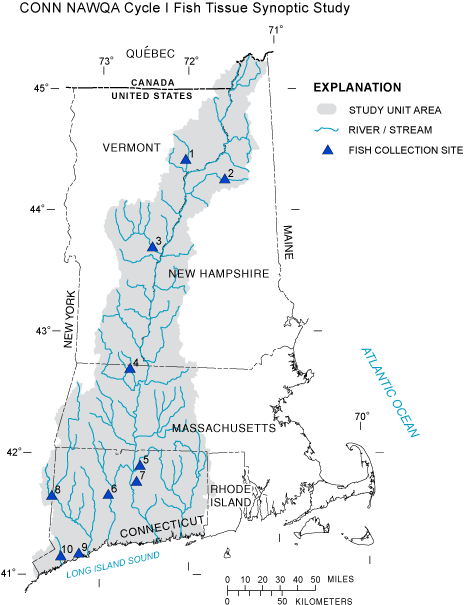
The image shows a map of the Connecticut NAWQA Cycle I Fish Tissue Synoptic Study, with text and numbers indicating the study area.
Read full description
The image shows a map of the Connecticut NAWQA Cycle I Fish Tissue Synoptic Study, with text and numbers indicating the study area. The map is filled with various shades of blue, indicating the different levels of fish tissue in the region. The text on the map provides additional information about the study, such as the type of tissue, the number of fish, and the location of the study.