Public domain photos
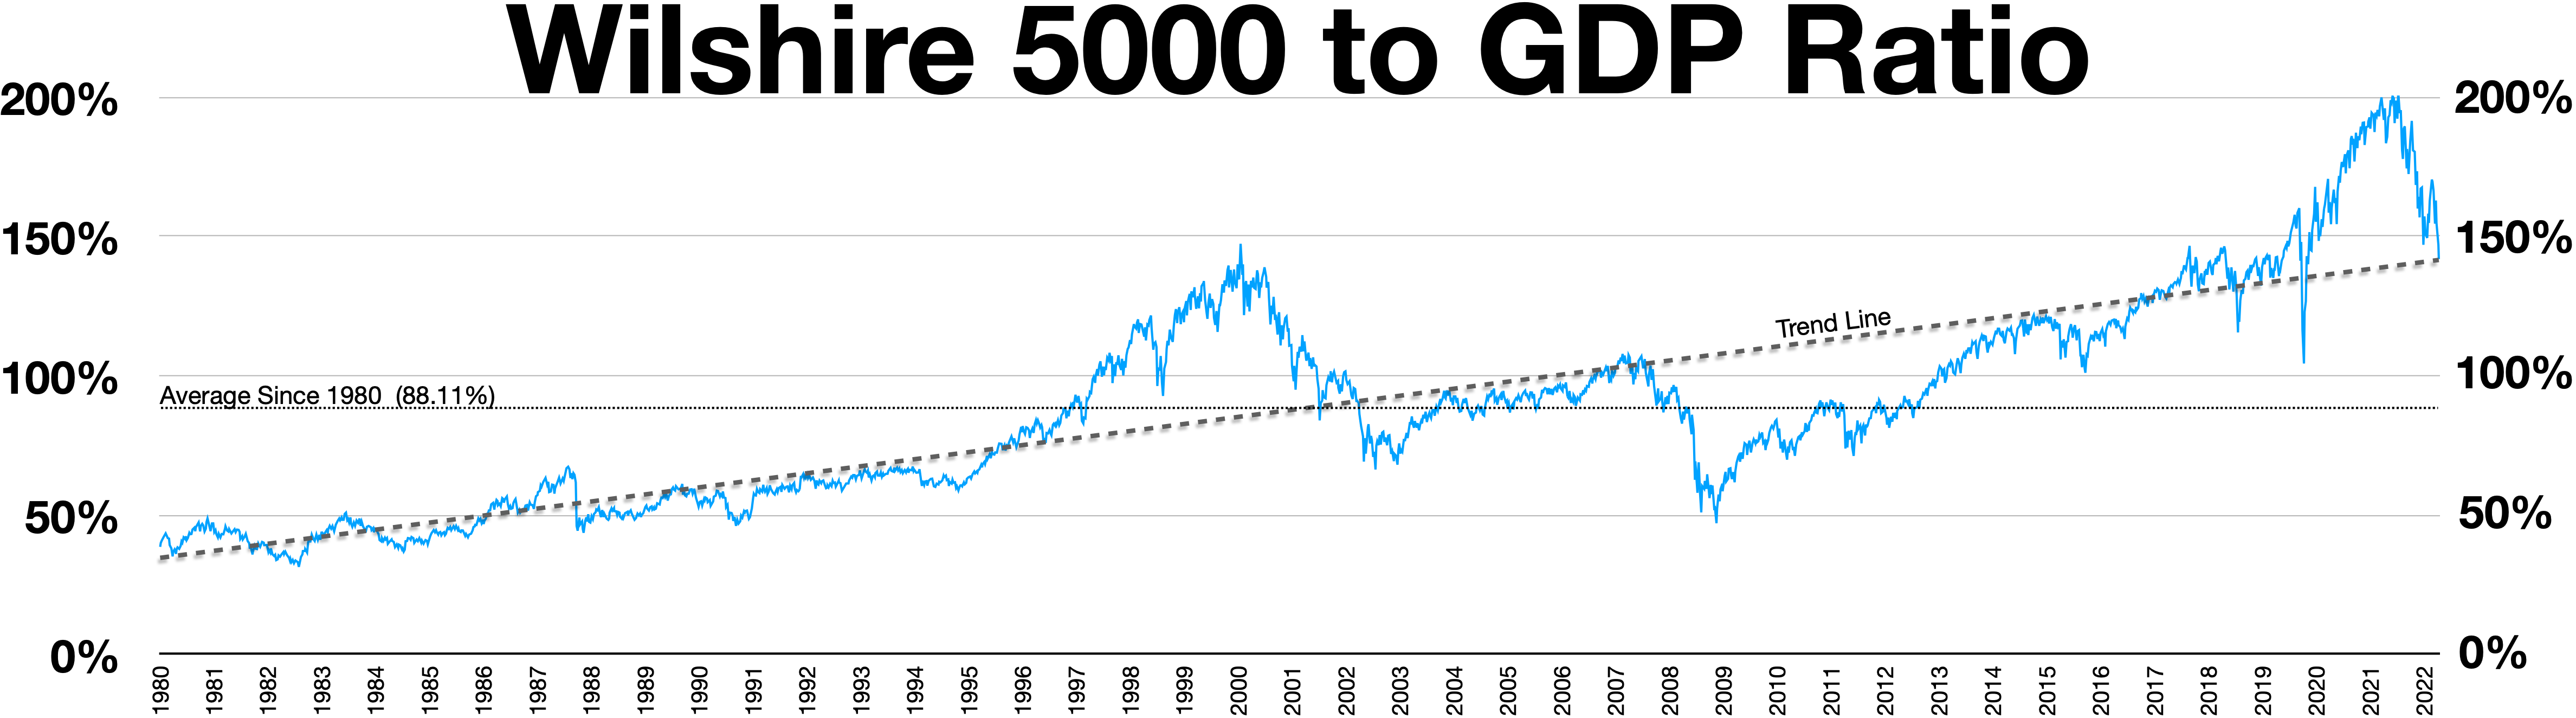
The image shows a blue graph on a white background with the words "wishire 5000 to gdp ratio" written at the top. The graph displays the ratio of the Wilshire 5000 to the Gross Domestic Product (GDP) over a period of time.
 Open in library