Public domain photos
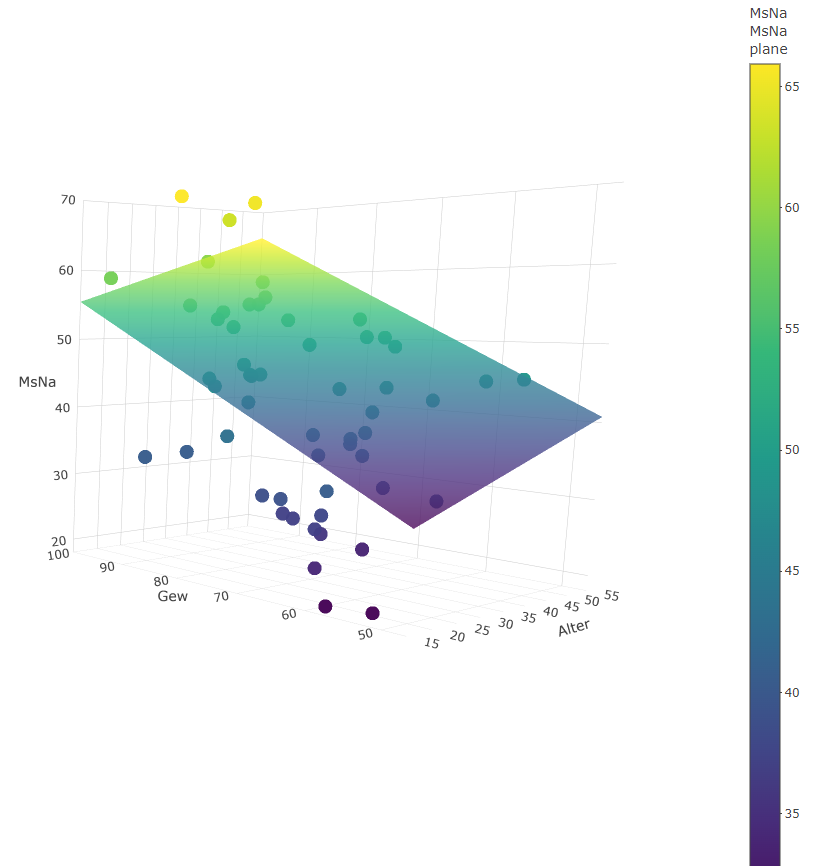
The image shows a scatter plot with a white background, featuring a color chart with different colored dots and text. The plot is used to illustrate the correlation between the number of people who have been diagnosed with cancer.
 Open in library