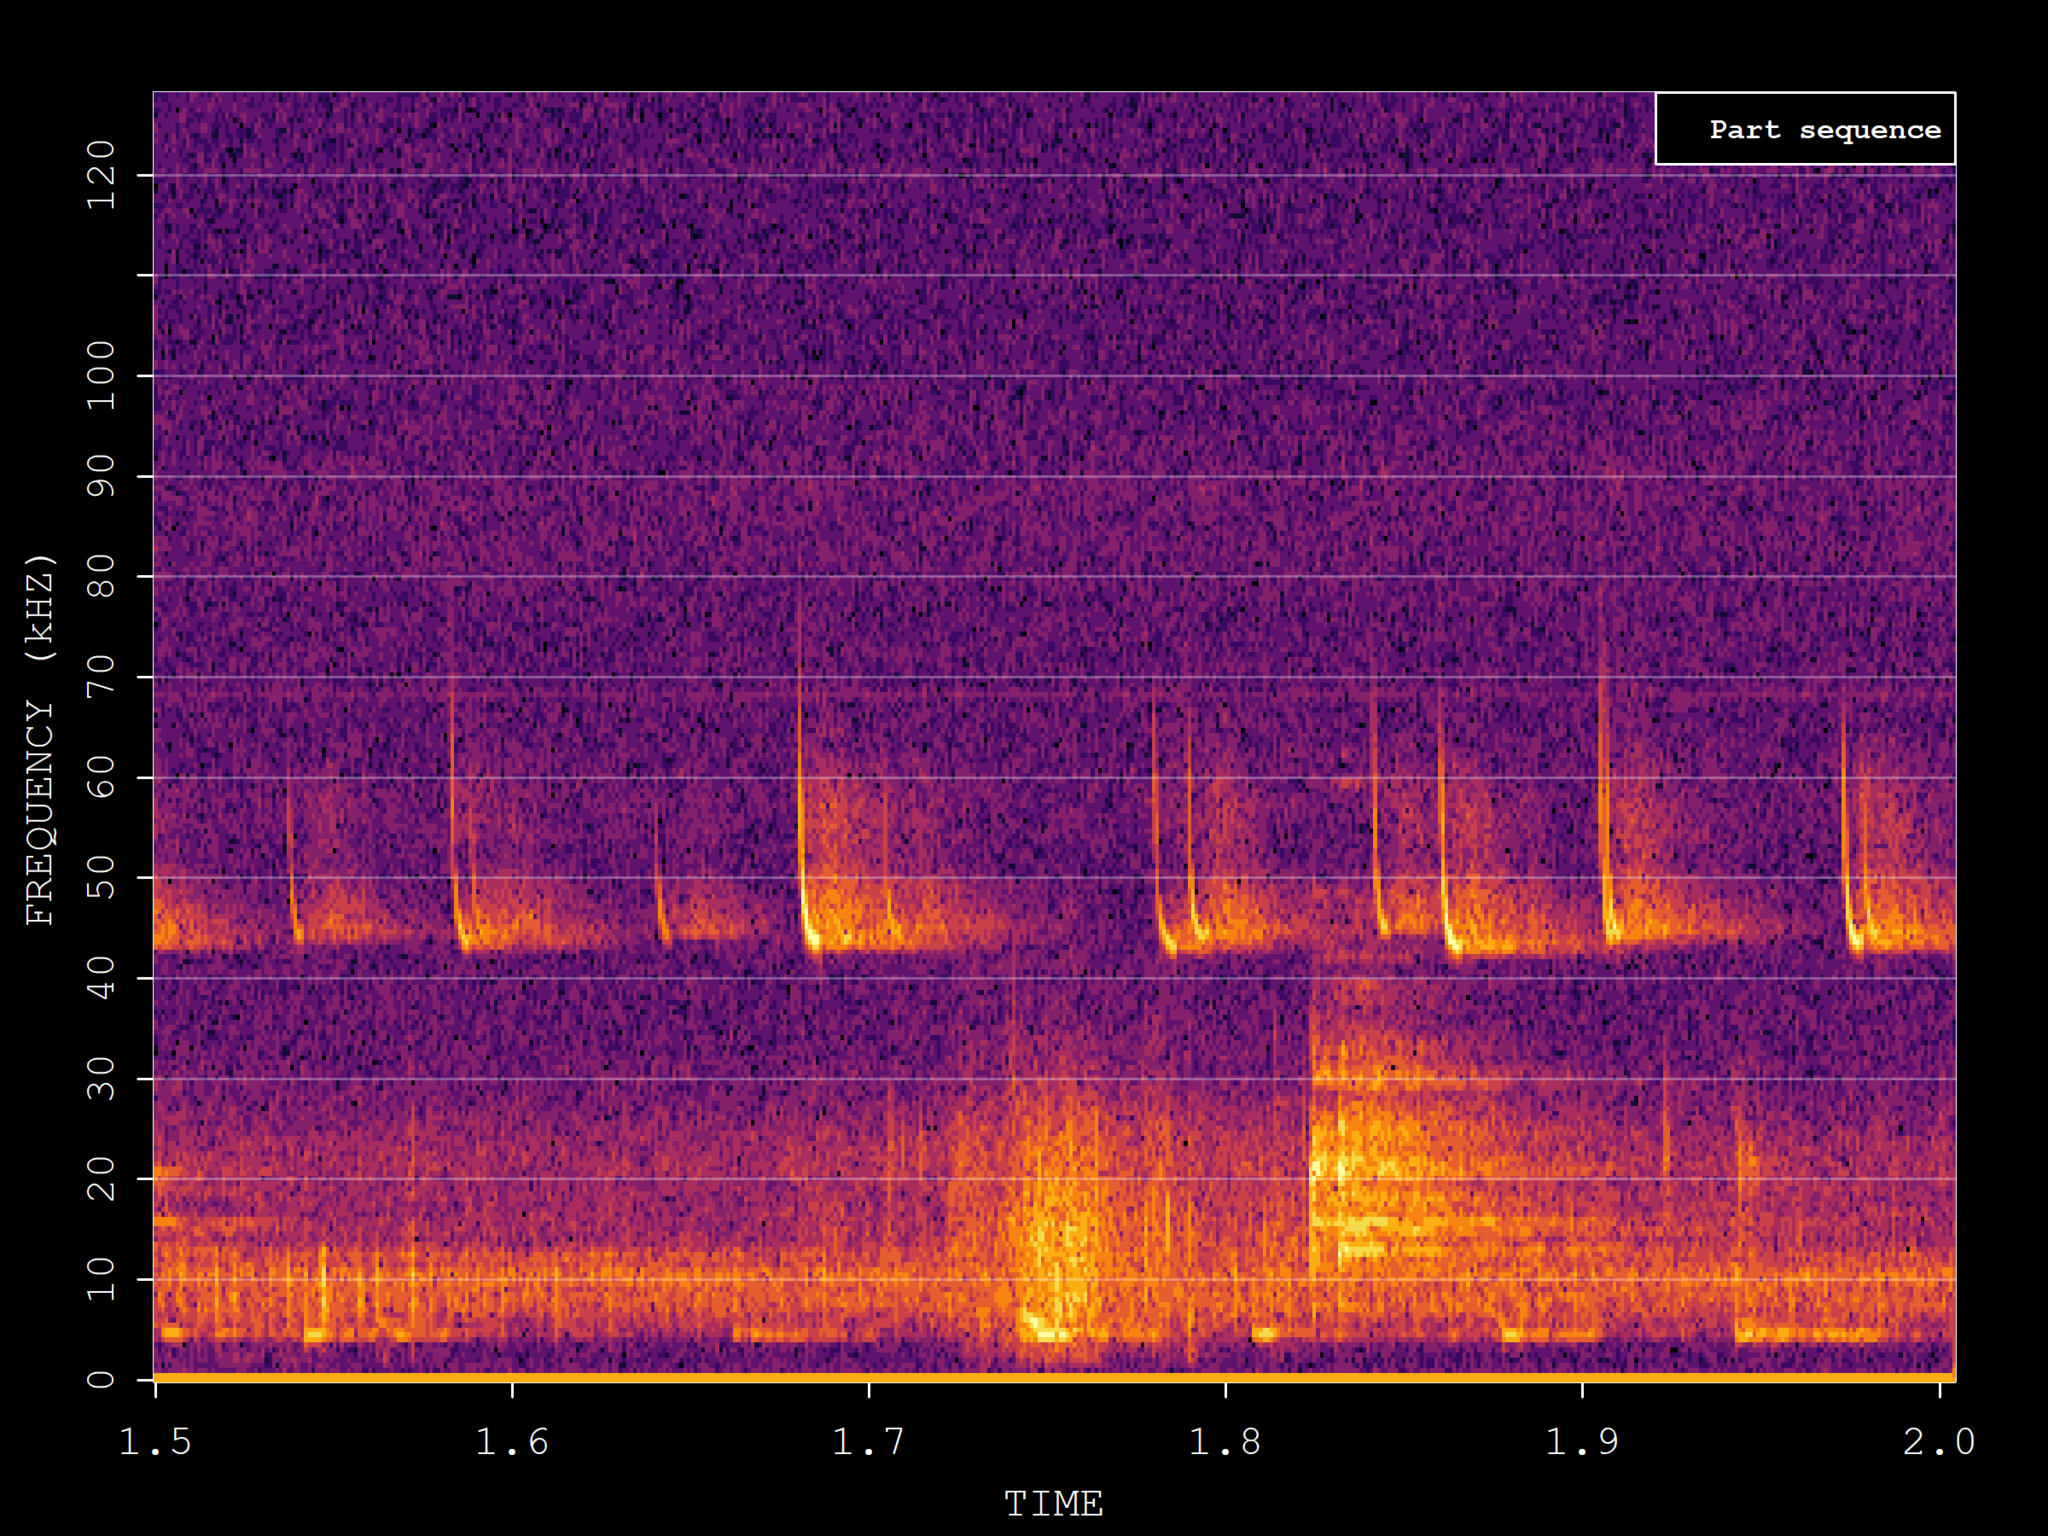
The image shows a plot of a waveform on a computer screen with a black background.
Read full description
The image shows a plot of a waveform on a computer screen with a black background. The waveform is composed of a series of concentric circles, each representing a different frequency. The colors of the circles range from light blue to dark blue, indicating the intensity of the waveform. The text on the screen provides additional information about the waveforms.