Public domain photos
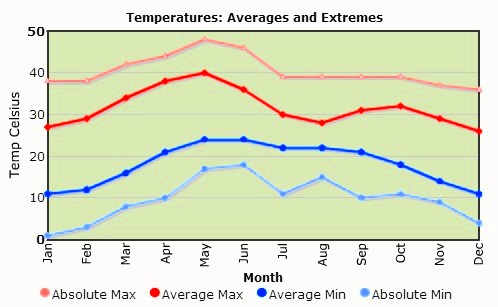
The image shows a graph depicting the average and extreme temperatures in the United States. The graph is composed of two lines, one in blue and one in red, that represent the temperatures over a period of time. The blue line represents the average temperature, while the red line indicates the extreme temperatures. The text accompanying the graph provides further information about the data.
 Open in library