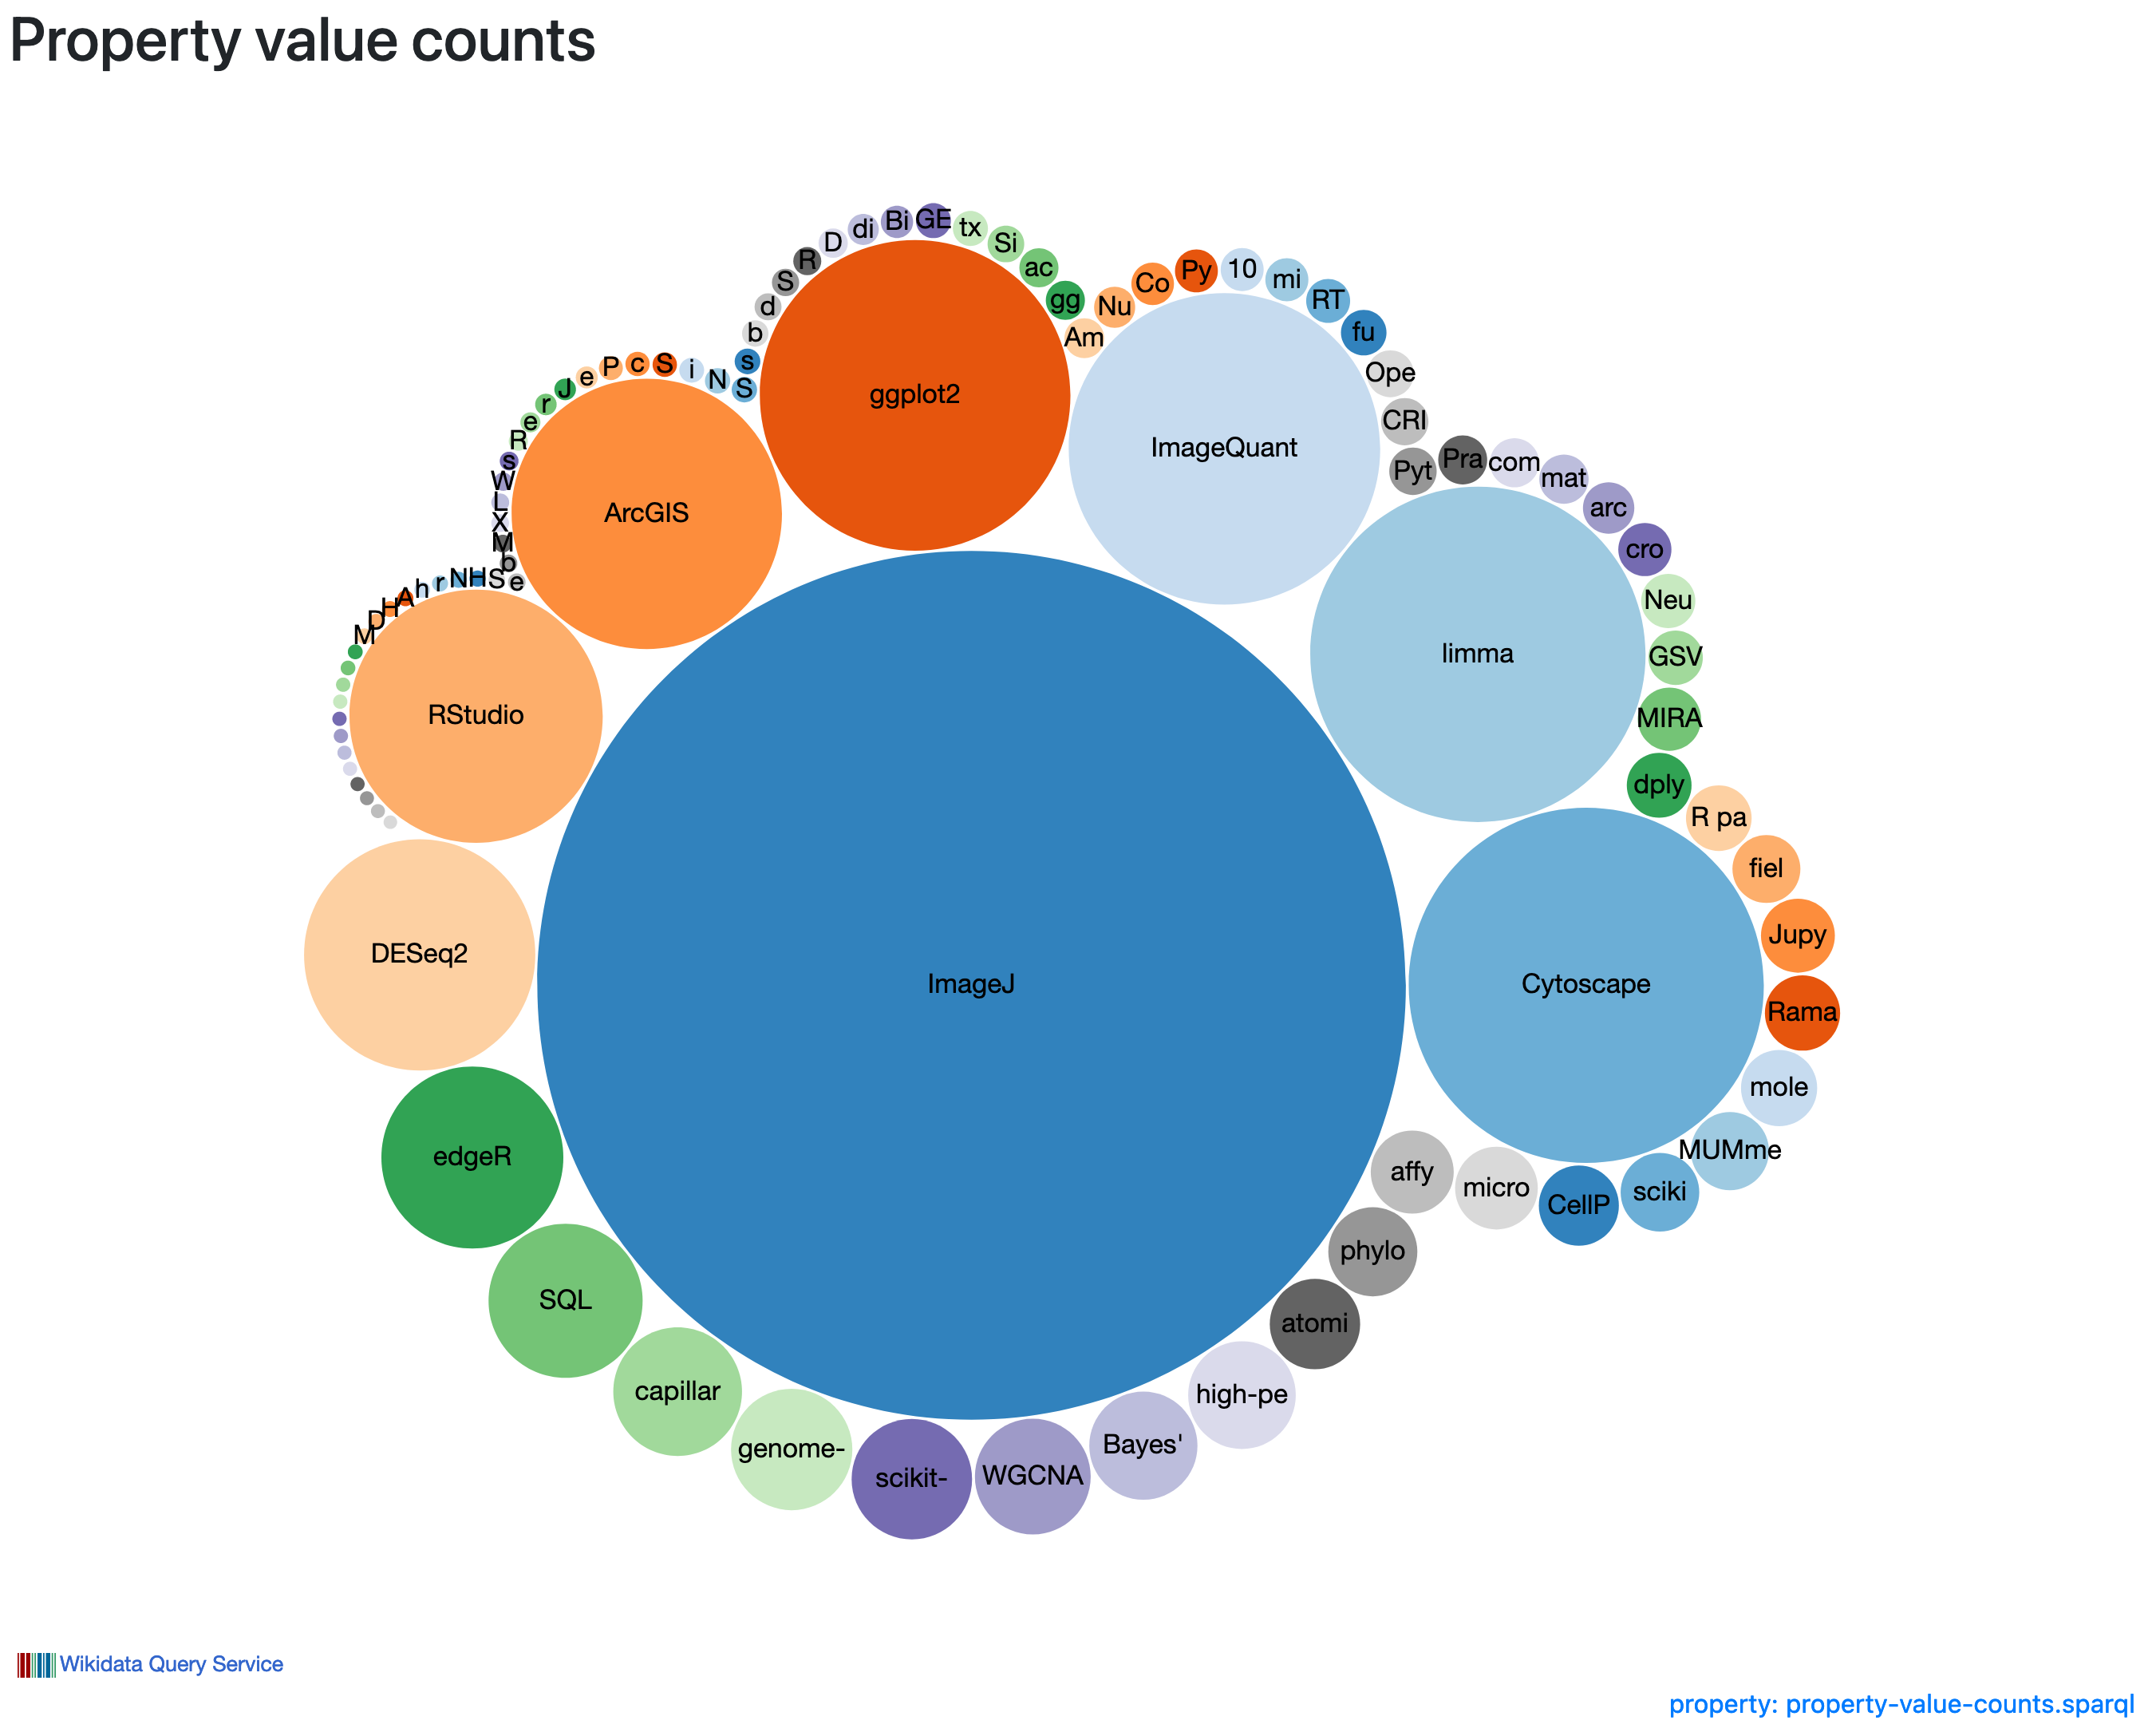
The image shows a Venn diagram with different colored circles representing property value counts.
Read full description
The image shows a Venn diagram with different colored circles representing property value counts. The circles are arranged in a radial pattern, with each circle representing a different property value. The colors of the circles range from light blue to dark blue, with the lightest blue being the most prominent. The text around the circles reads "Property Value Counts" in bold, black font.