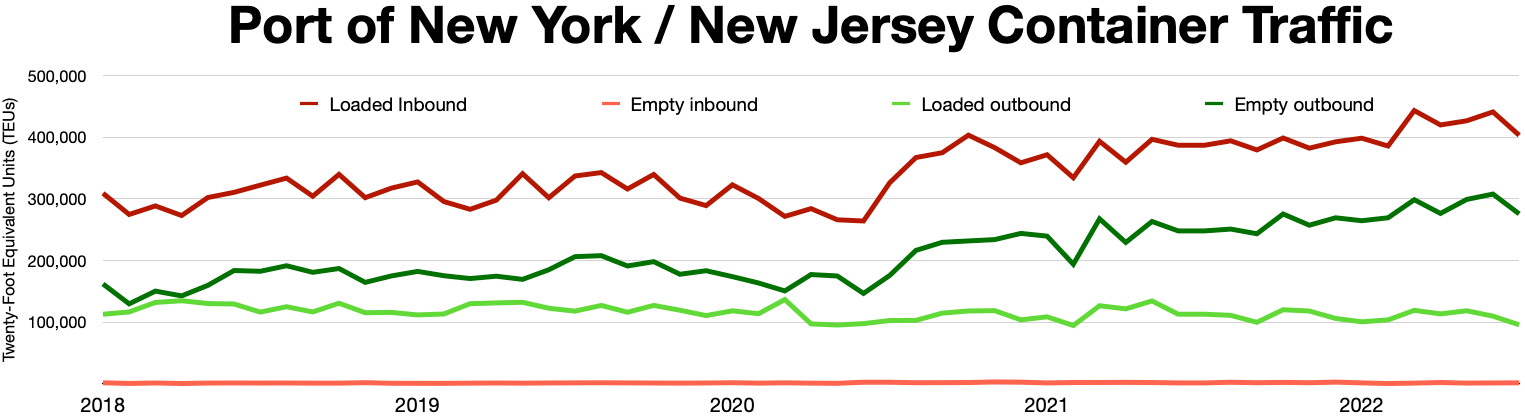
The image shows a graph on a white background with text that reads "Port of New York/New Jersey Container Traffic".
Read full description
The image shows a graph on a white background with text that reads "Port of New York/New Jersey Container Traffic". The graph displays the number of containers in the port of New Jersey, with the x-axis representing the months of the year and the y-axis indicating the amount of traffic. The graph is divided into four sections, each representing a different month, and each section is further divided into two subsections, one for each month. The colors of the sections vary, with darker colors representing higher traffic and lighter colors representing lower traffic.