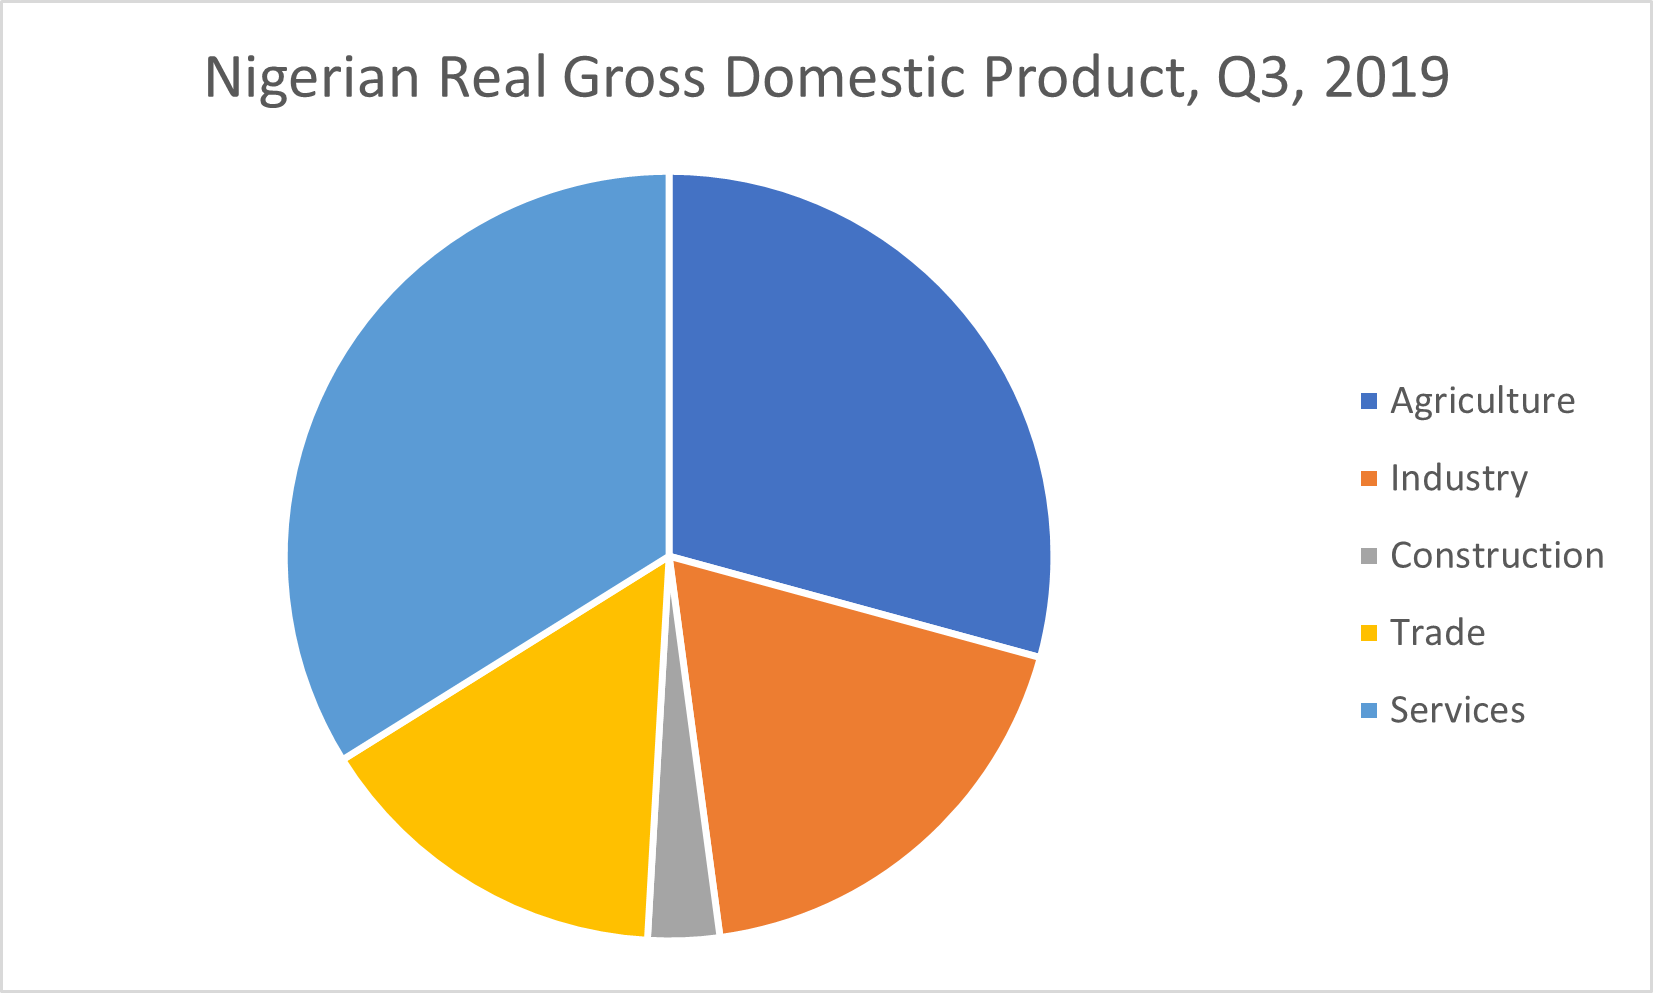
The image shows a white background with a pie chart depicting the Nigerian real gross domestic product market from Q3 2019.
Read full description
The image shows a white background with a pie chart depicting the Nigerian real gross domestic product market from Q3 2019. The chart is divided into sections, each representing a different segment of the market, such as agriculture, construction, trade, and services. The text accompanying the chart provides further details about the market.