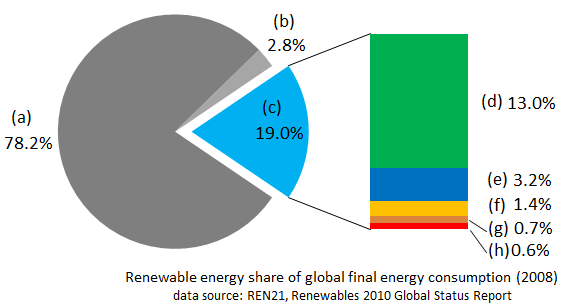
The image shows a pie chart depicting the renewable energy share of global final energy consumption.
Read full description
The image shows a pie chart depicting the renewable energy share of global final energy consumption. The chart is divided into several sections, each representing a different energy source, such as solar, wind, and renewable energy. The size of each section indicates the percentage of energy consumed in that energy source. The text accompanying the chart provides further information about the data being presented.