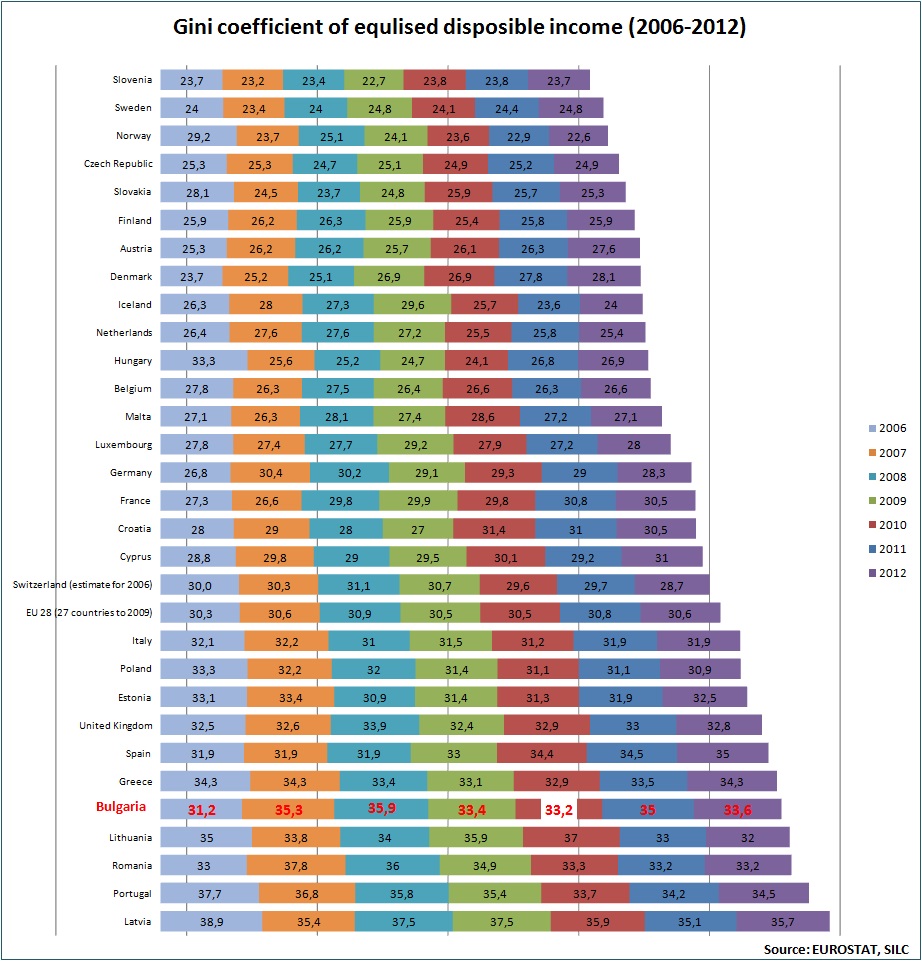
The image shows a bar chart depicting the coefficient of equivalent disposable income from 2006 to 2012.
Read full description
The image shows a bar chart depicting the coefficient of equivalent disposable income from 2006 to 2012. The chart is composed of different colors, each representing a different income source, and the text at the top of the chart provides further information about the data.