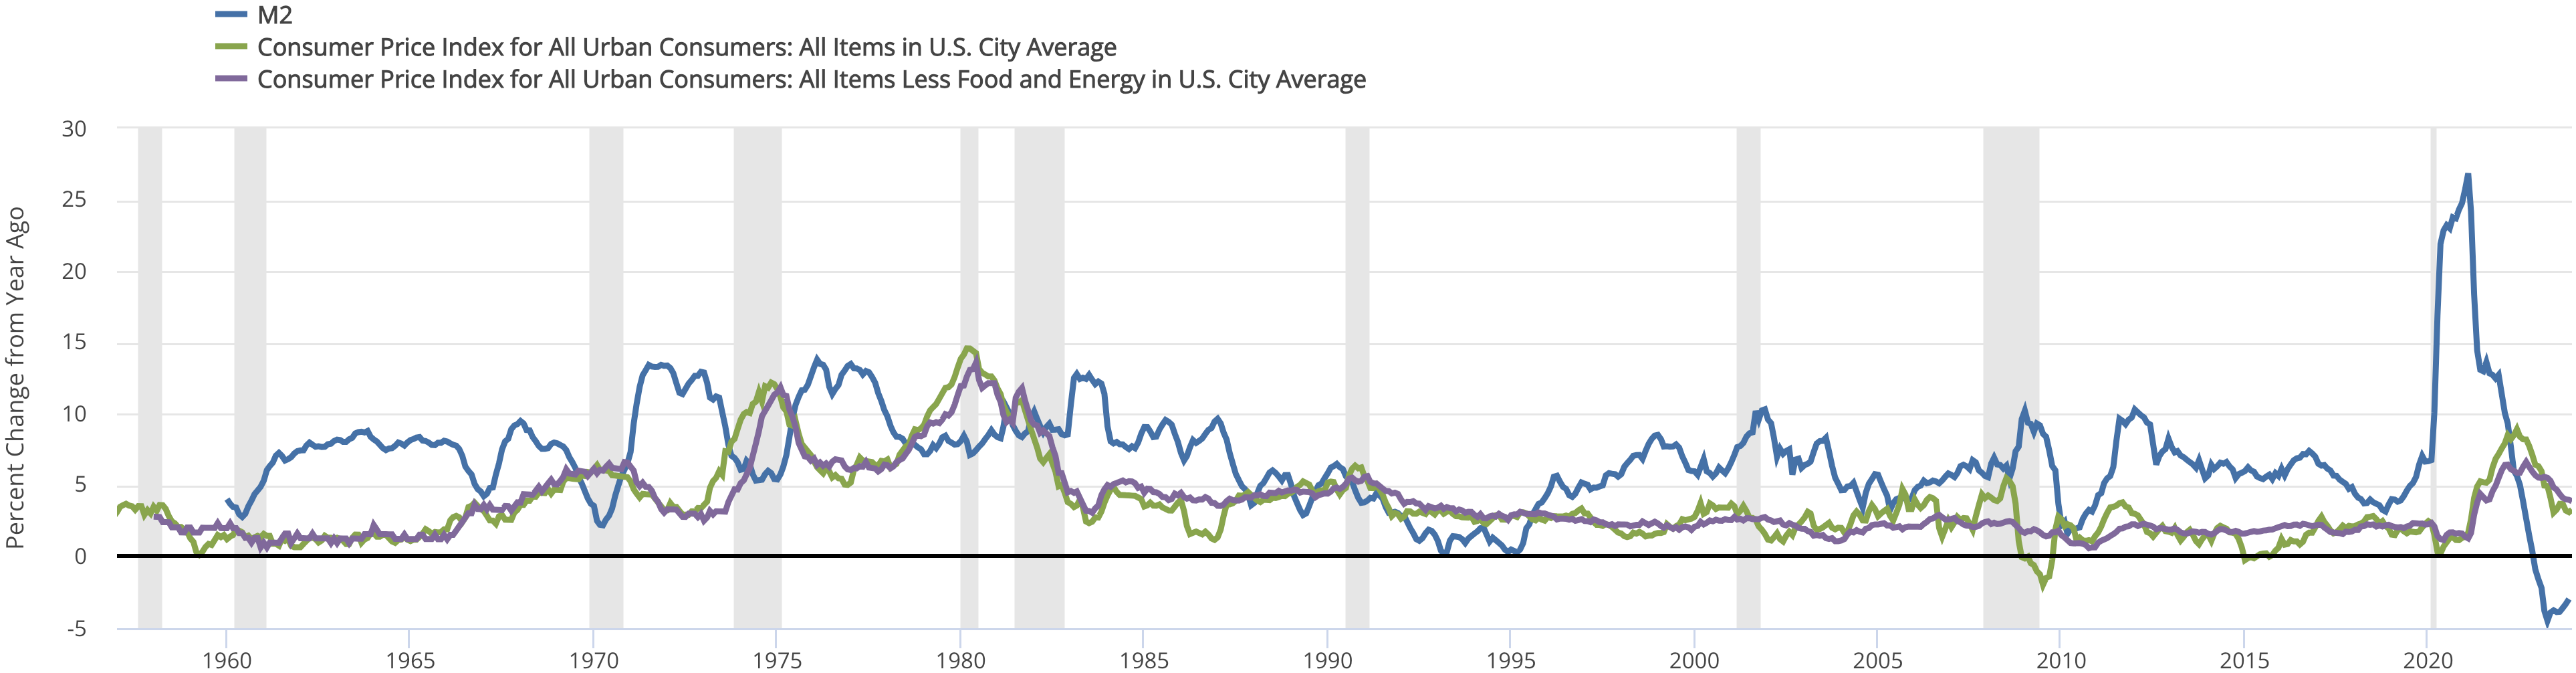
The image shows a graph depicting the consumer price index for all urban consumers in the United States.
Read full description
The image shows a graph depicting the consumer price index for all urban consumers in the United States. The graph is composed of different colors, each representing a different year, and the text at the top of the image reads "Consumer Price Index for All Urban Consumers".