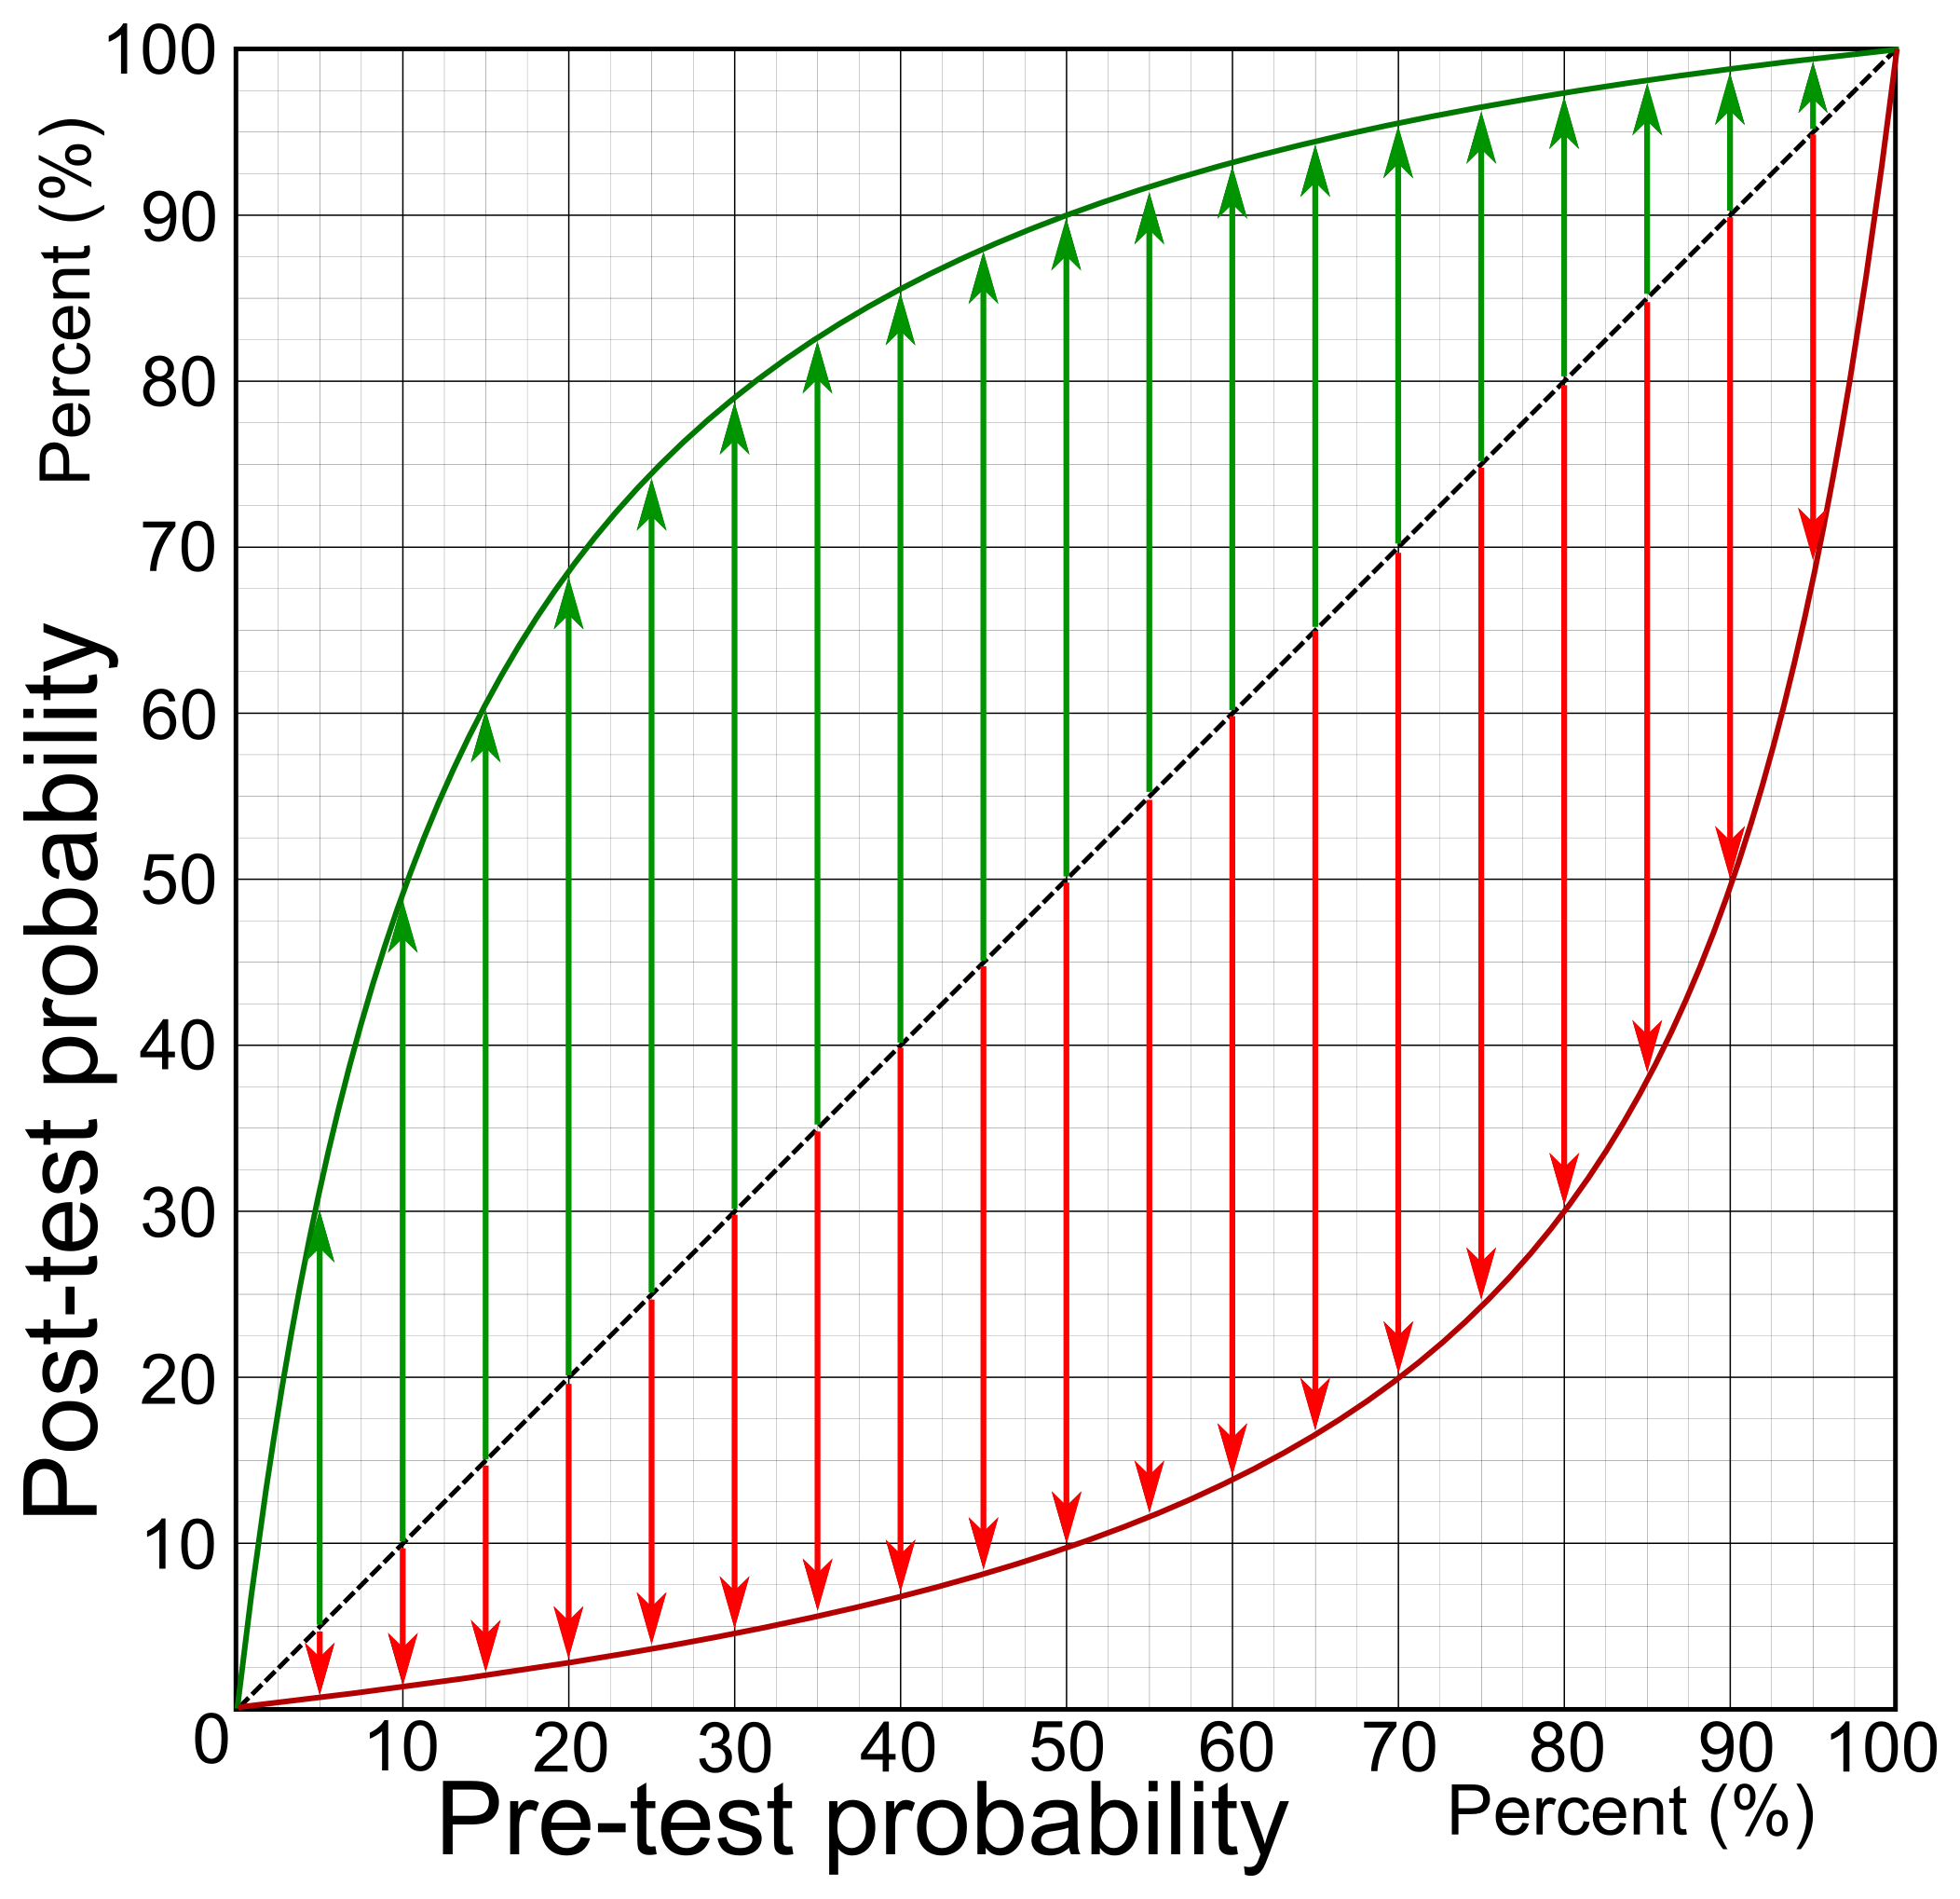
The image shows a graph depicting the probability of a pre-test test, with the text "Pre-Test Probability" at the top and bottom of the image.
Read full description
The image shows a graph depicting the probability of a pre-test test, with the text "Pre-Test Probability" at the top and bottom of the image. The graph is composed of a series of points connected by a line, with each point representing a different probability. The x-axis of the graph is labeled with the probability range, while the y-axis is labeled as the probability curve.