Public domain photos
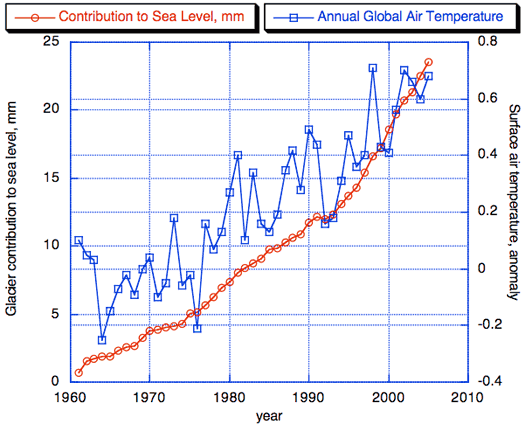
The image shows a graph on a white background depicting the contribution to sea level and global air temperature. The graph is composed of a series of points connected by a line, with the x-axis representing the years and the y-axis indicating the amount of air temperature in millions of years. The points are labeled with the corresponding year and the line is colored in shades of blue, green, and red.
 Open in library