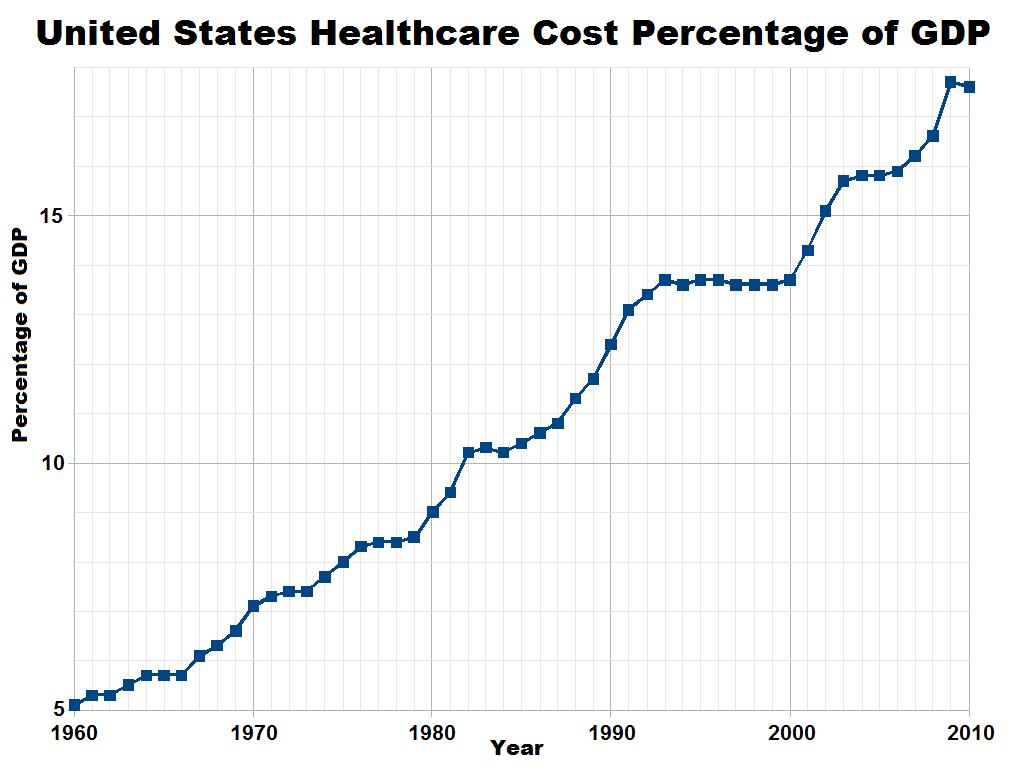
The image shows a graph on a white background with text that reads "United States Healthcare Cost Percentage of GDP".
Read full description
The image shows a graph on a white background with text that reads "United States Healthcare Cost Percentage of GDP". The graph is a line graph with a blue line that is steadily increasing, indicating the cost of healthcare in the United States. The x-axis of the graph is labeled with the years, while the y-axis is labeled as the percentage of GDP. The graph also includes a legend that explains the meaning of the colors used in the graph.