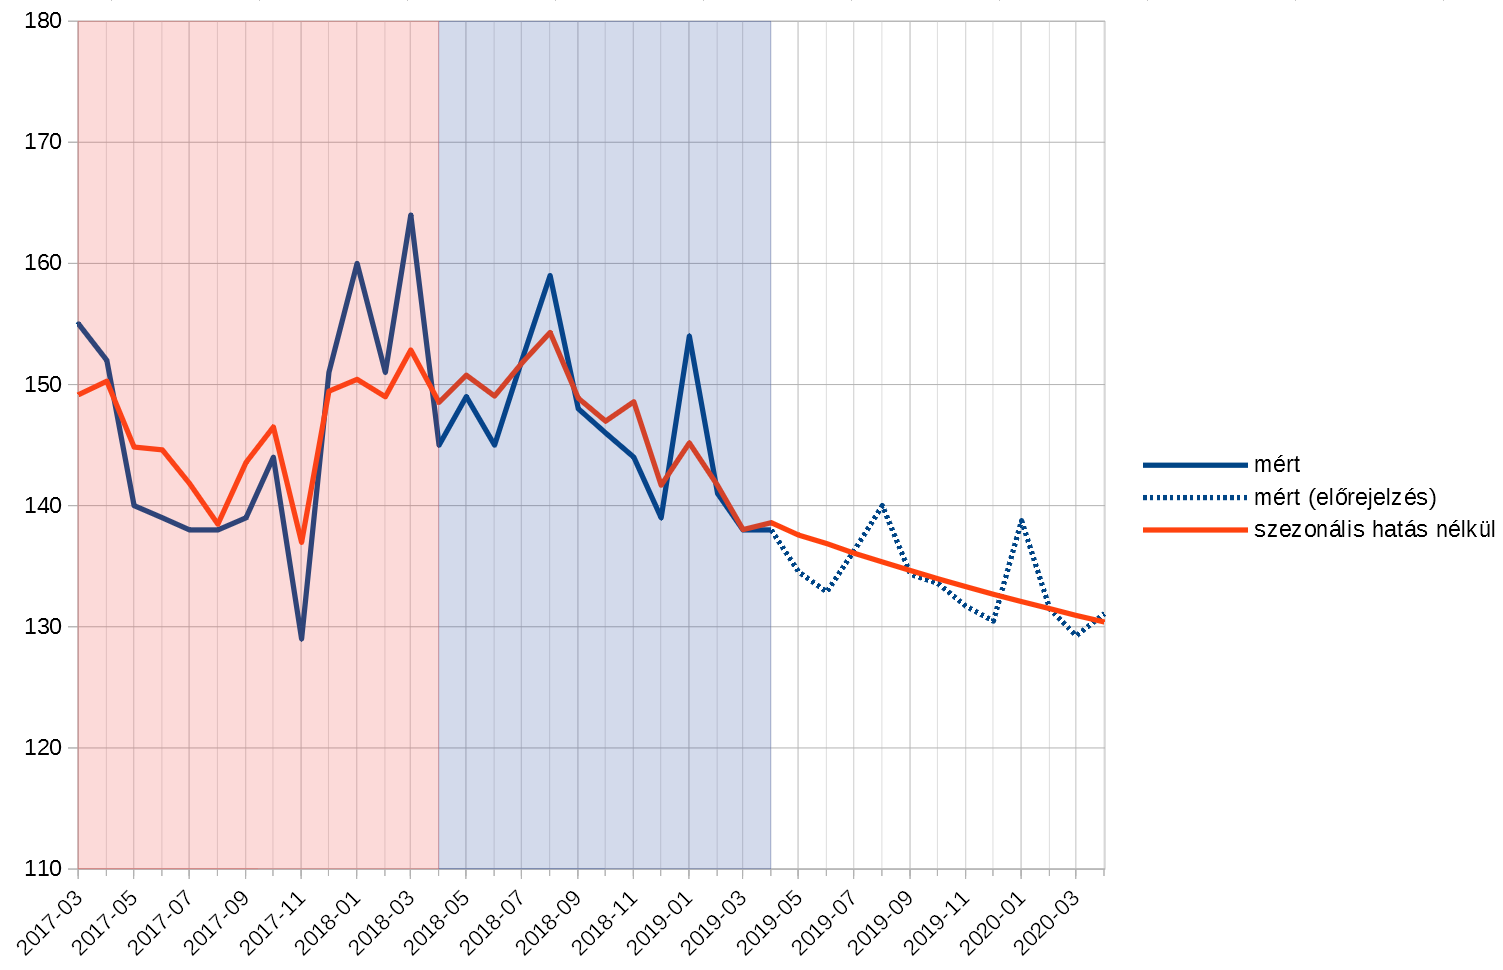
The image shows a graph on a white background with text that displays the number of people who have died in a car accident.
Read full description
The image shows a graph on a white background with text that displays the number of people who have died in a car accident. The graph is divided into two sections, one in blue and one in red, and each section is further divided into different colors. The blue section is labeled "Number of People Who Died in Car Accident" and the red section is marked with a red line. The text on the graph provides further information about the data being presented.