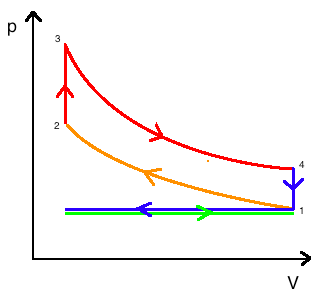
The image shows a graph of the demand curve for a product, with a white background.
Read full description
The image shows a graph of the demand curve for a product, with a white background. The graph is composed of two lines, one in red and one in blue, with arrows pointing in opposite directions. The red line is labeled "P" and the blue line is labelled "V".