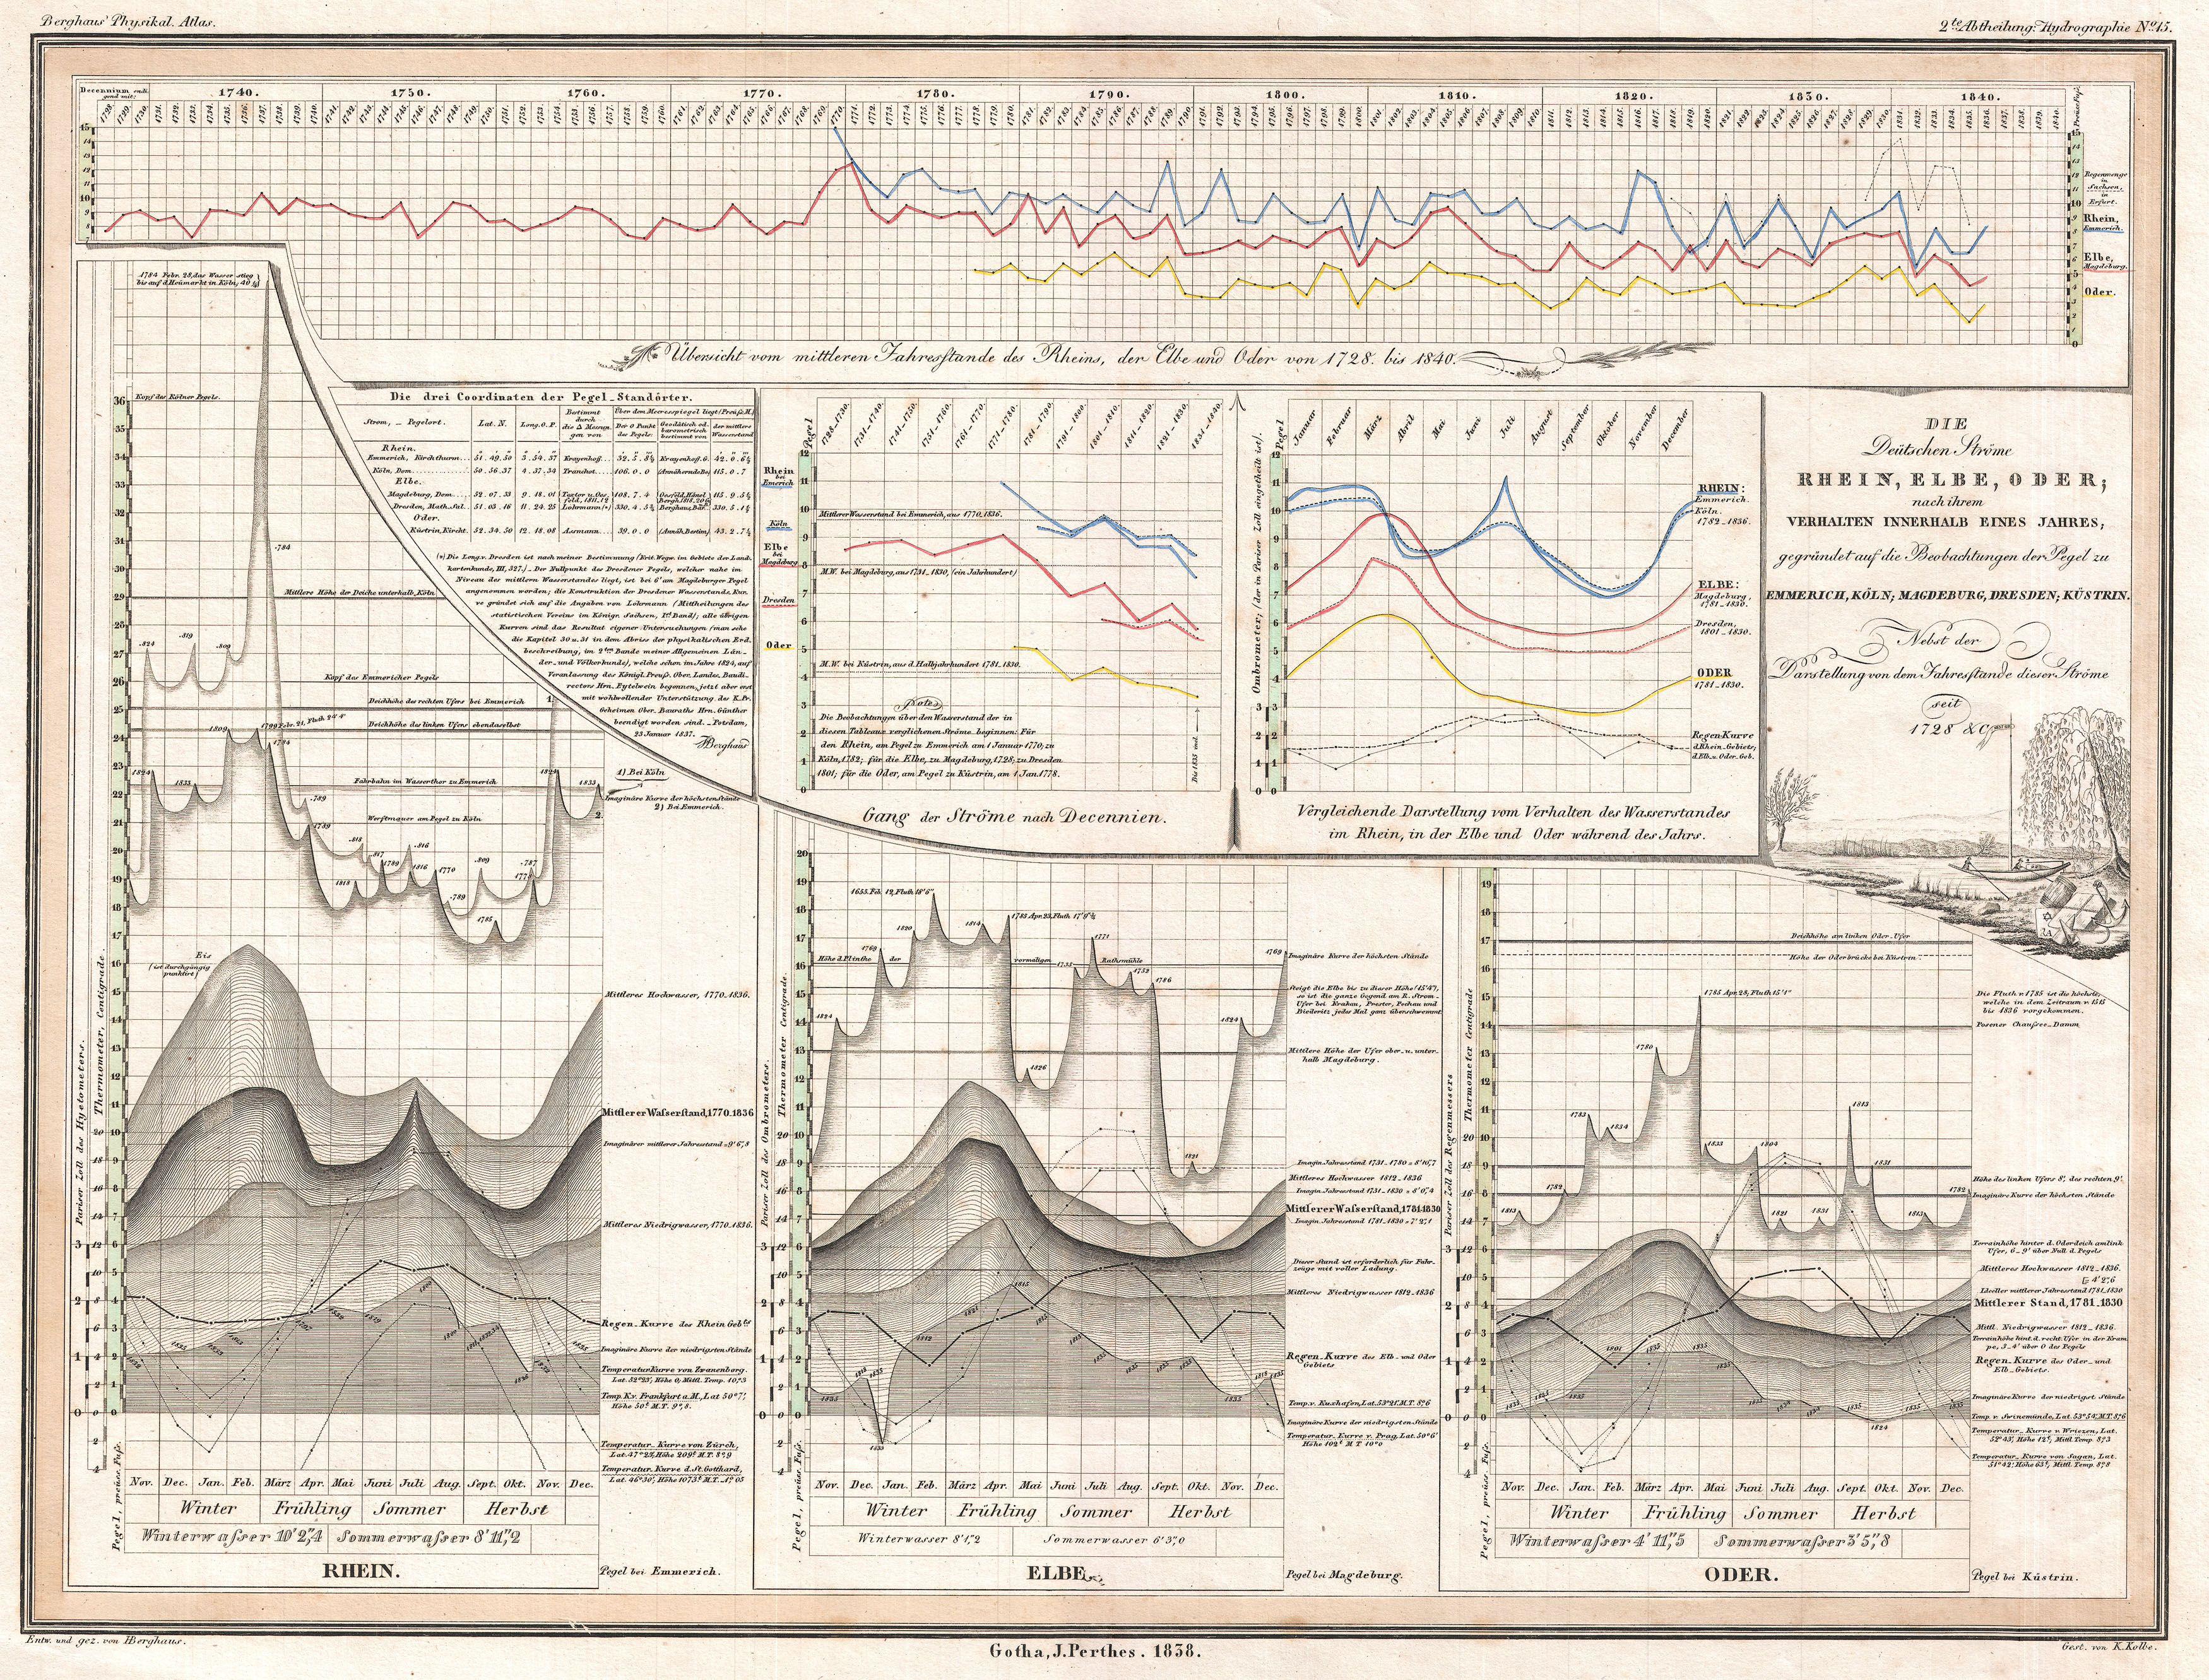
The image shows a paper with graphs and text on it, depicting the different types of graphs on a white background.
Read full description
The image shows a paper with graphs and text on it, depicting the different types of graphs on a white background. The graphs are arranged in a grid pattern, with each graph representing a different type of data. The text on the paper provides further information about the data, such as the number of people who have been diagnosed with cancer.