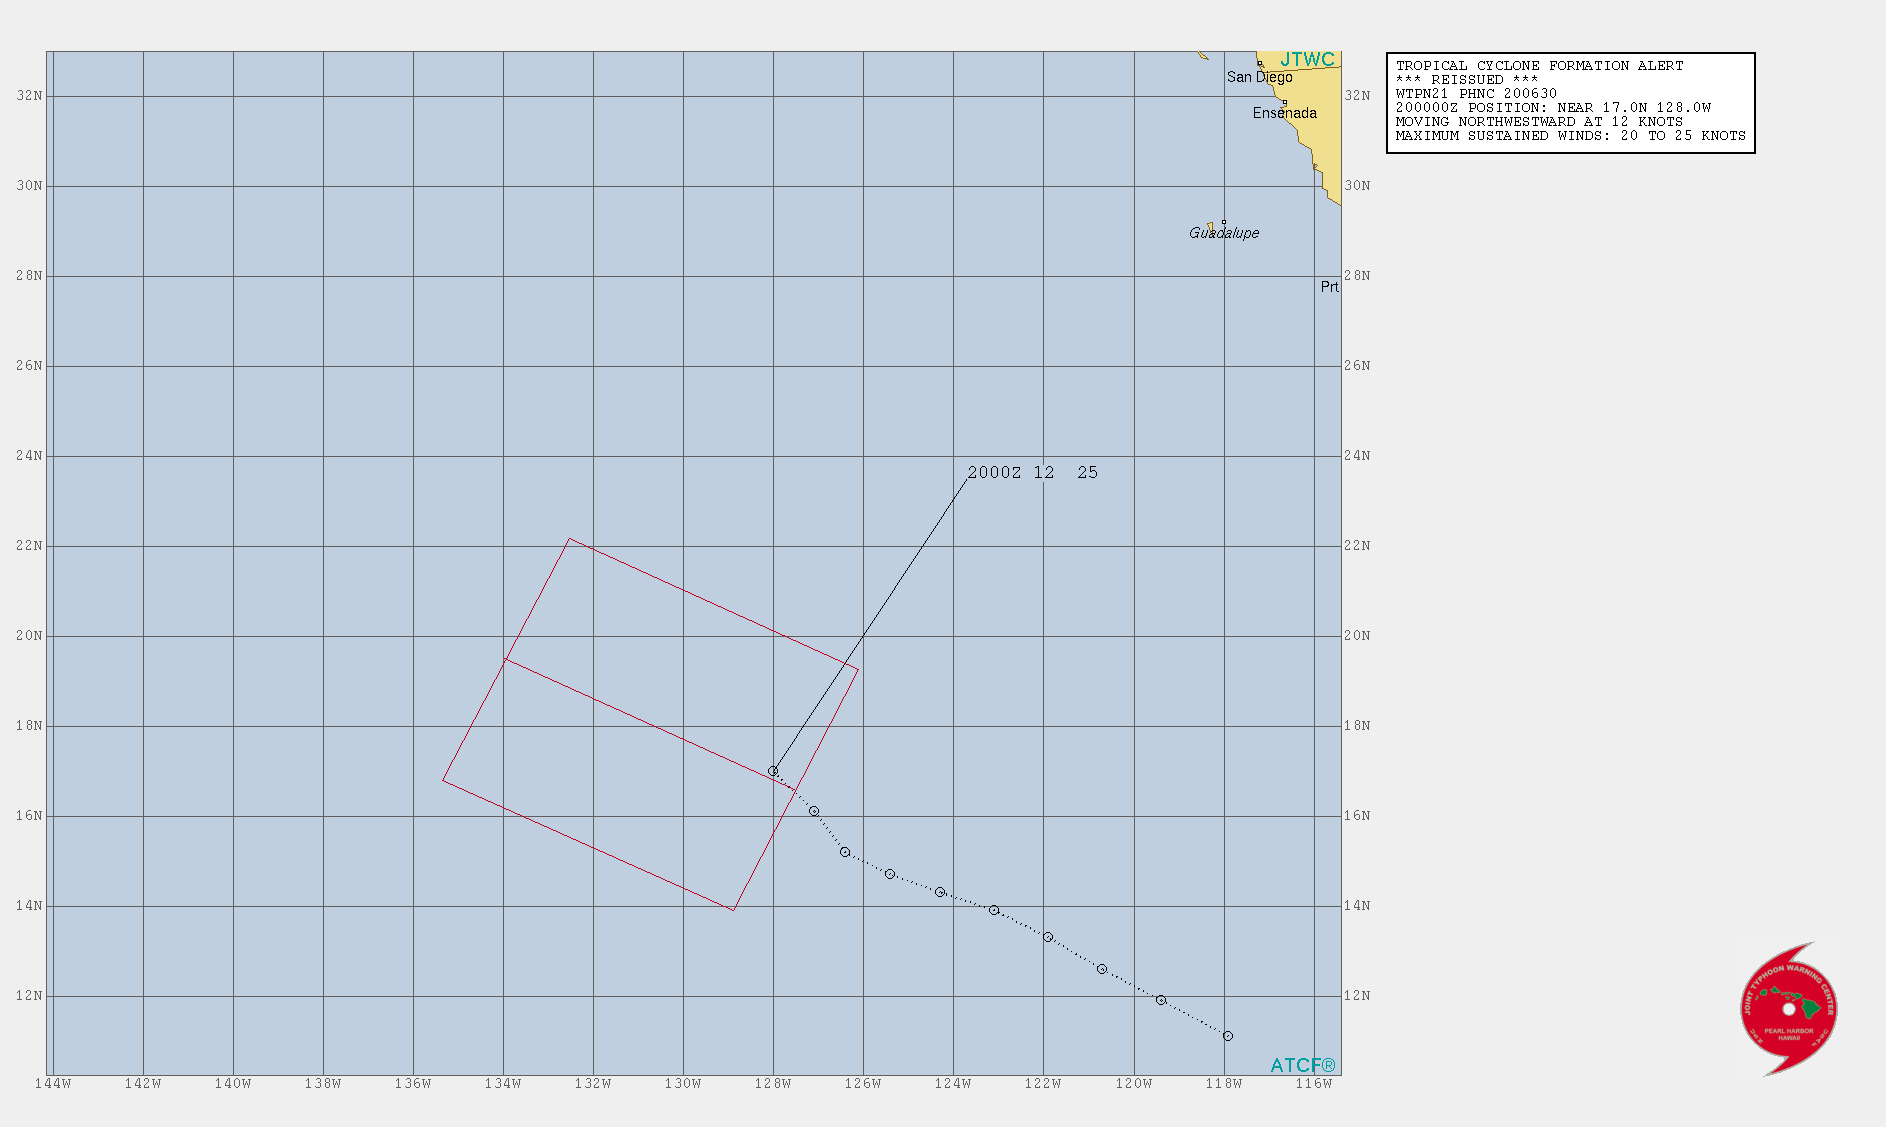
The image shows a graph with a red line in the middle of it, which is a plot of the magnetic field.
Read full description
The image shows a graph with a red line in the middle of it, which is a plot of the magnetic field. The graph is composed of a series of points connected by a line, and the red line is used to indicate the magnetic fields. The text on the graph provides further information about the field, such as the type of magnetic field and the magnitude of the field.