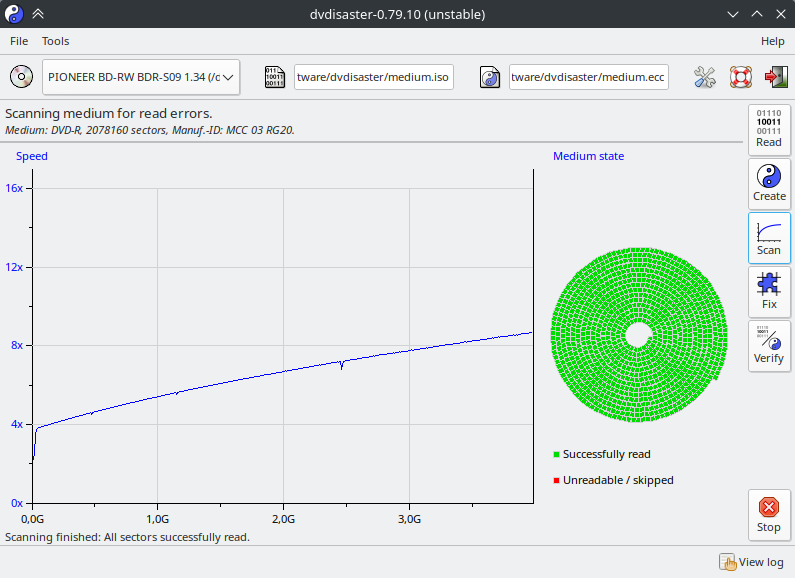
The image shows a computer screen with a graph on it, displaying the results of a dvd disaster scan using the pioneer bd-rw-rw bdr-509 software.
Read full description
The image shows a computer screen with a graph on it, displaying the results of a dvd disaster scan using the pioneer bd-rw-rw bdr-509 software. The graph is composed of a series of points connected by a line, with the x-axis representing the time period and the y-axis indicating the number of read errors. The text on the screen provides further information about the scan, such as the type of scan, the duration of the scan and the accuracy of the data.