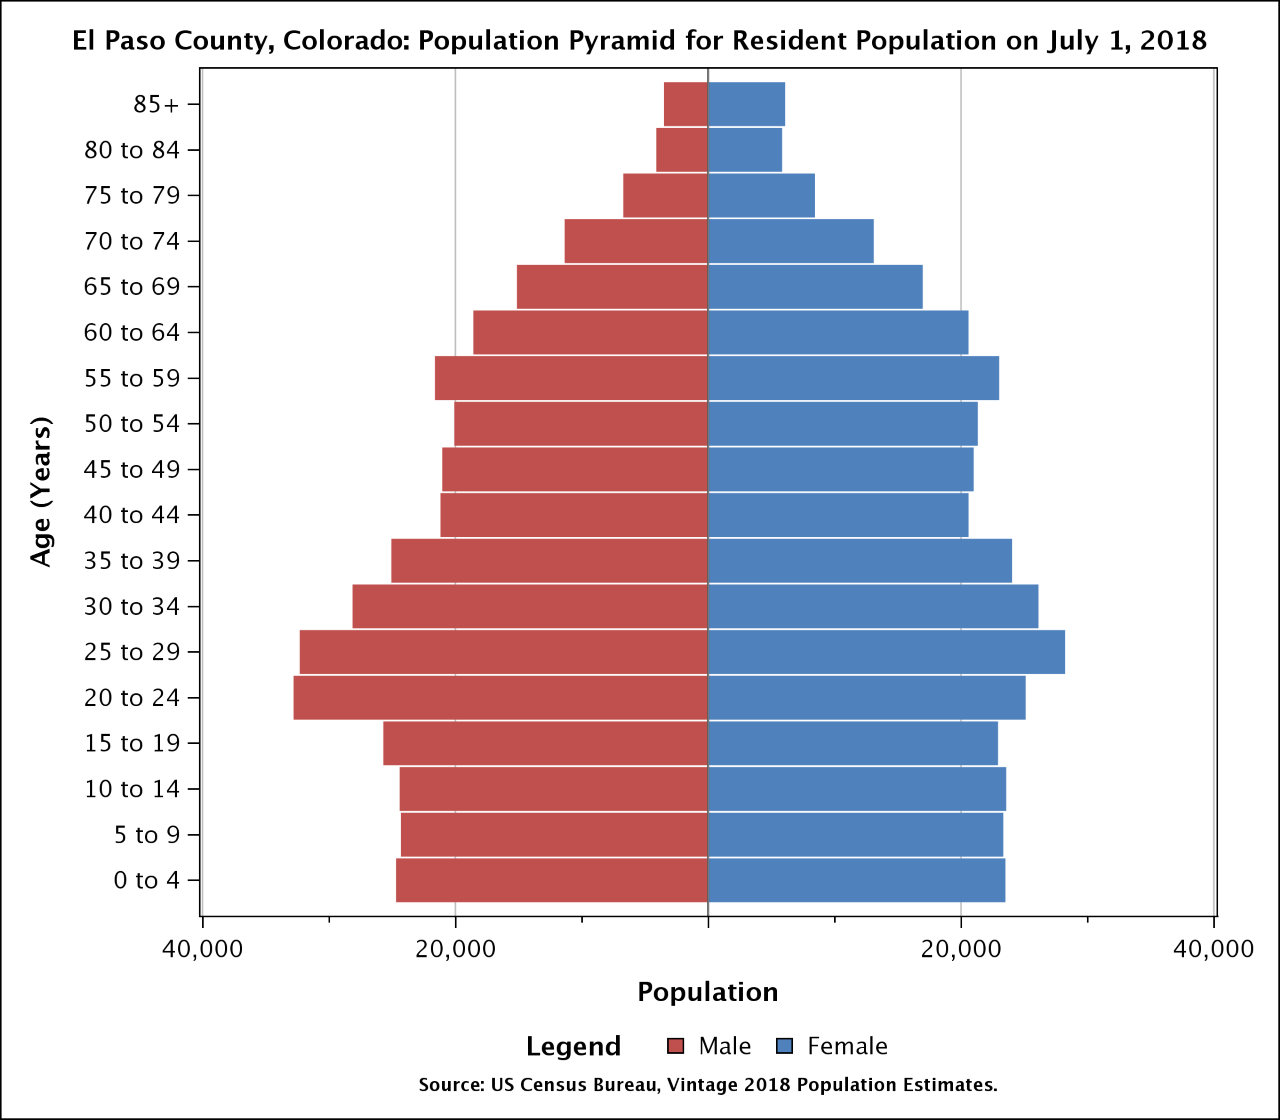
The image shows a graph depicting the population pyramid for El Paso County, Colorado on July 1, 2018.
Read full description
The image shows a graph depicting the population pyramid for El Paso County, Colorado on July 1, 2018. The graph is composed of a series of bars, each representing a different population, with the height of each bar indicating the number of people living in the county. The text at the top of the graph reads "El Paso County Population Pyramid for Resident Population".