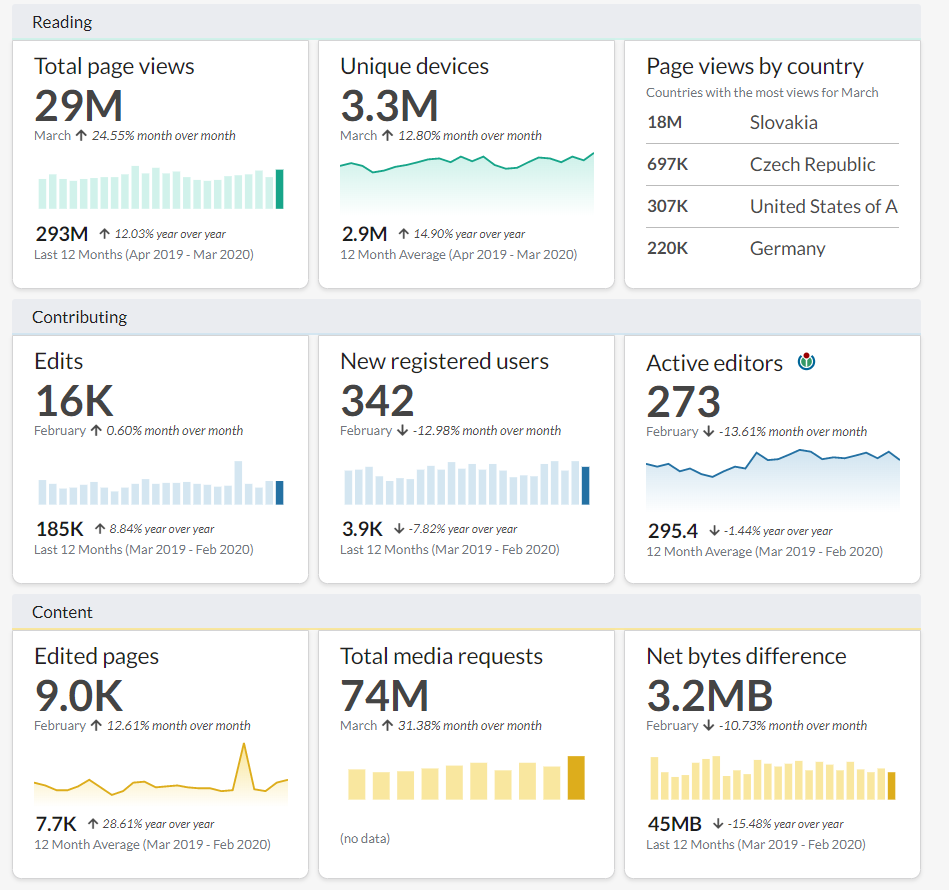
The image shows a dashboard with a variety of data, including text and graphs, which is part of the Google Analytics dashboard.
Read full description
The image shows a dashboard with a variety of data, including text and graphs, which is part of the Google Analytics dashboard. The dashboard is displayed on a computer screen, with the text providing information about the data, such as the number of pages visited, the total number of visitors, and the average time spent on each page. The graphs provide a visual representation of the data in detail, allowing users to easily monitor and analyze the performance of their website.