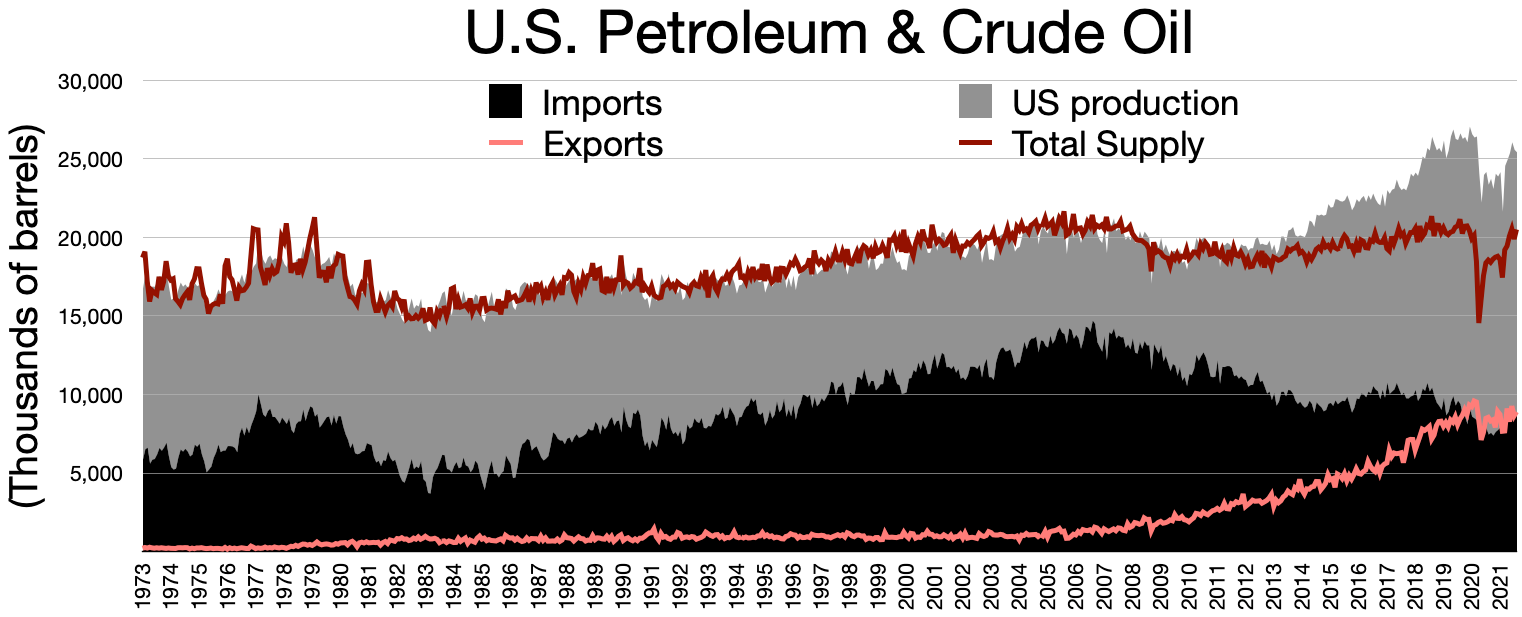
The image shows a graph on a white background with text that reads "U.S.
Read full description
The image shows a graph on a white background with text that reads "U.S. Petroleum & Crude Oil". The graph is composed of two lines, one representing the US petroleum and one representing crude oil, with the x-axis representing the years and the y-axis indicating the amount of oil produced. The graph also includes a legend that explains the meaning of the colors used in the graph.