Public domain photos
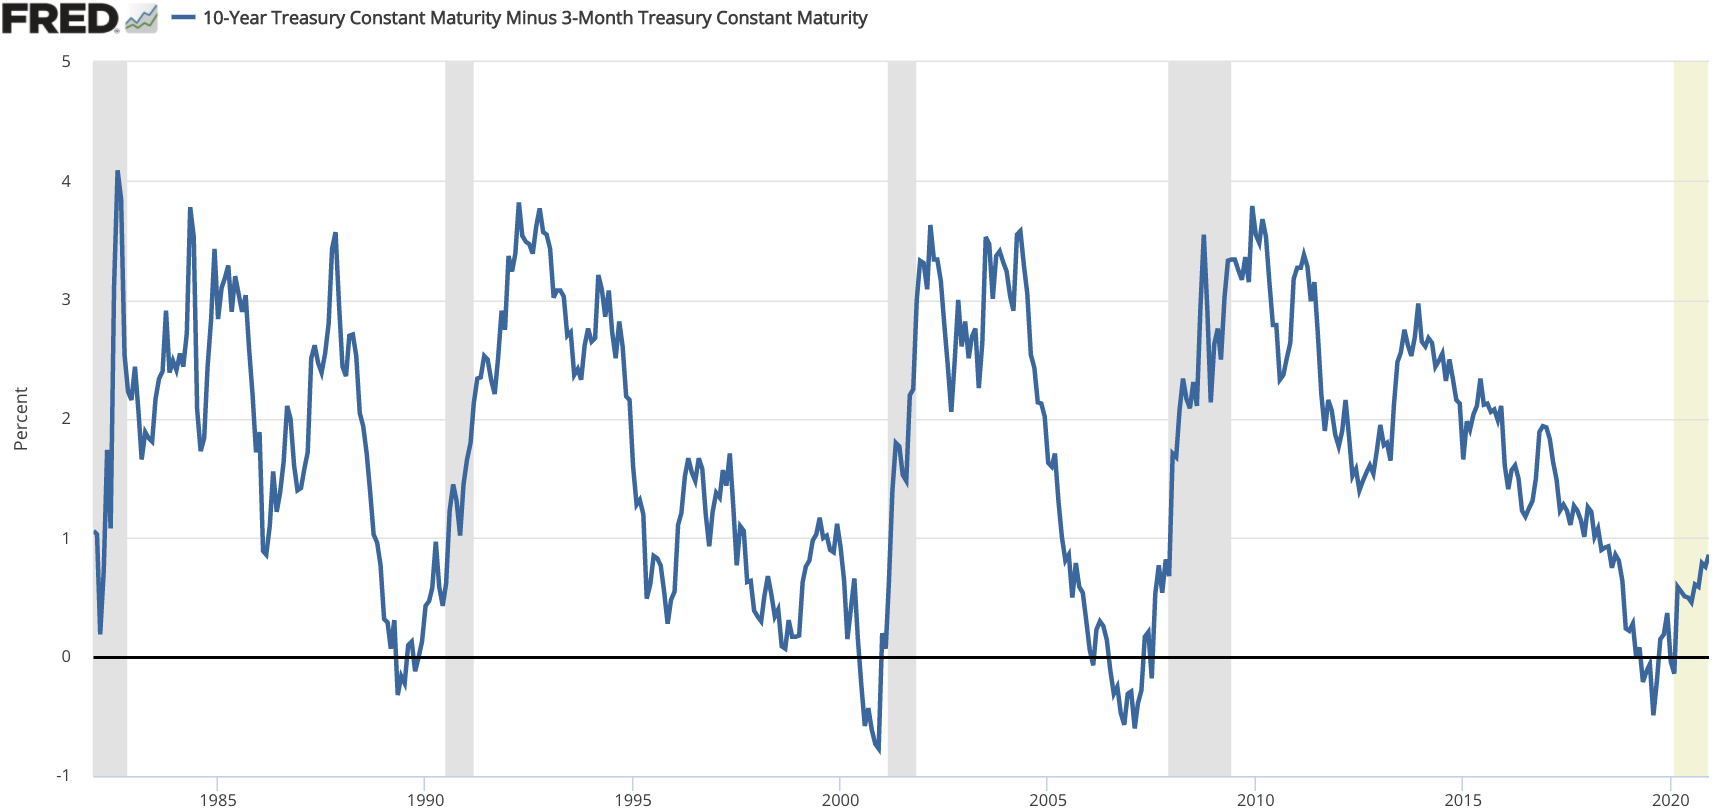
The image shows a graph on a white background with text that reads "10-year treasury constant maturity minus 3-month Treasury constant maturity". The graph displays the number of treasury bonds in the United States over a period of time, with the x-axis representing the years and the y-axis indicating the maturity rate. The graph also includes a legend that explains the meaning of the colors used in the graph.
 Open in library