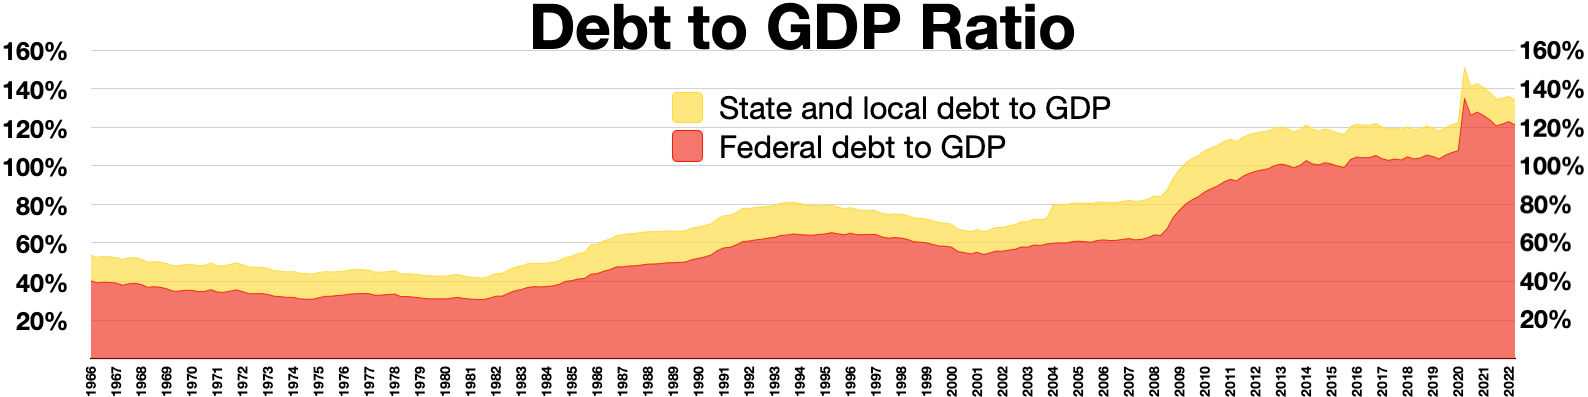
The image shows a graph depicting the debt to GDP ratio.
Read full description
The image shows a graph depicting the debt to GDP ratio. The graph is divided into two sections, one labeled "Debt to GDP Ratio" and the other labeled "Federal Debt to GDP". The x-axis of the graph is labeled with the years, while the y-axis is labeled as the percentage of debt. The colors used in the graph represent the different levels of debt, with the darker colors representing higher debt and the lighter colors representing lower debt.