Public domain photos
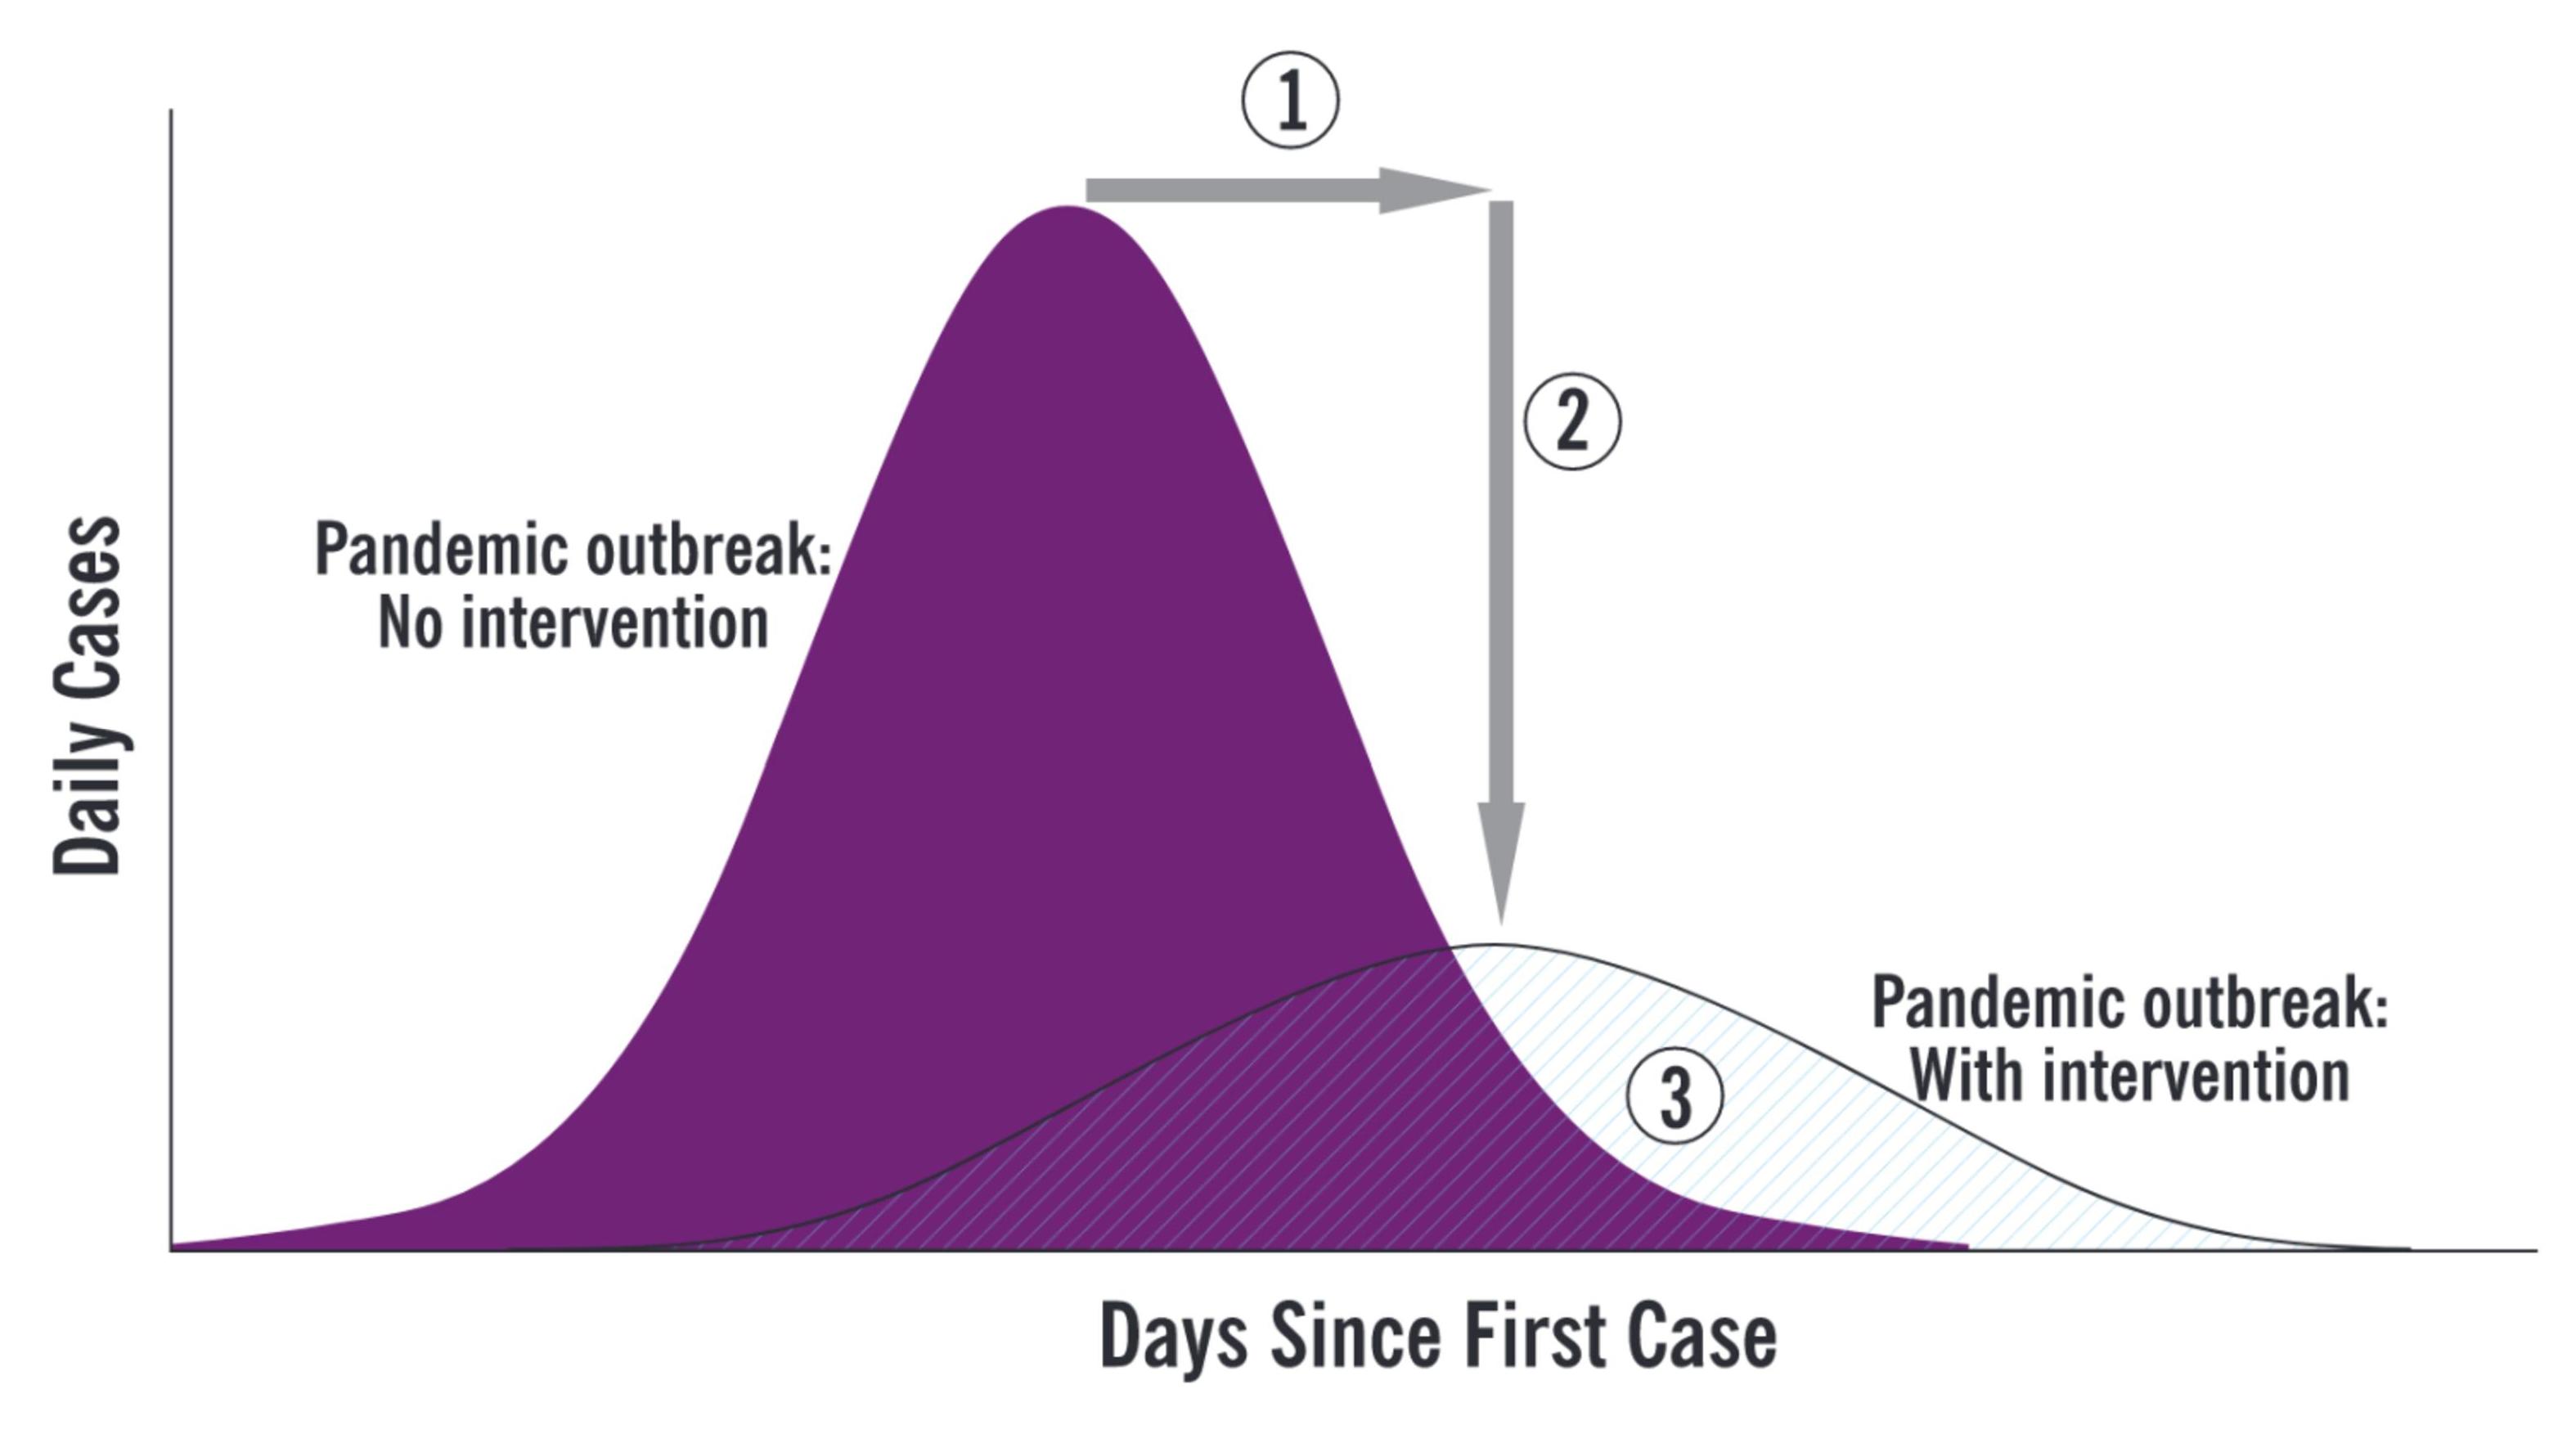
The image shows a graph depicting the number of cases of coronavirus in the United States, with a white background. The graph is divided into two sections, one labeled "PANDEMIC OUTBREAK" and the other labeled "NO INTERVENTION". The x-axis of the graph is labeled with the days since the first case, while the y-axis is labeled as the number.
 Open in library