Read full description
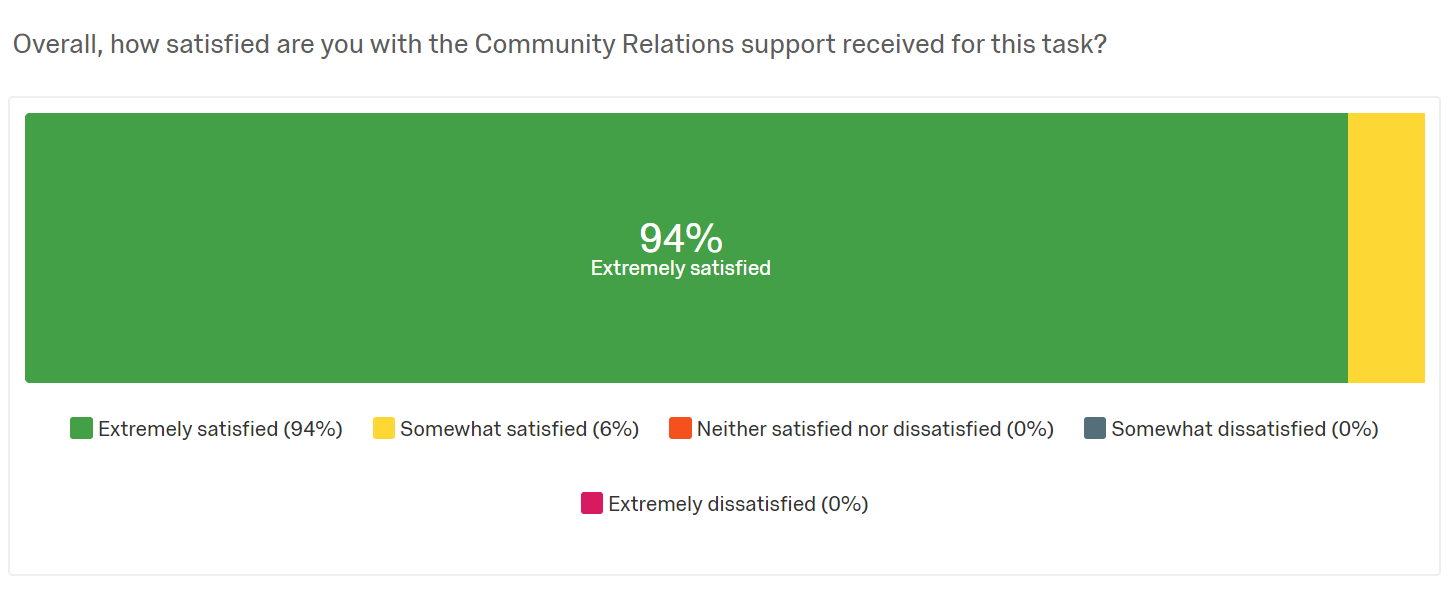
The image shows a screenshot of a dashboard with a bar chart depicting the percentage of people who have been satisfied with the community relations support received. The chart is divided into two sections, one in green and one in yellow, and each section is further divided into percentages and text.