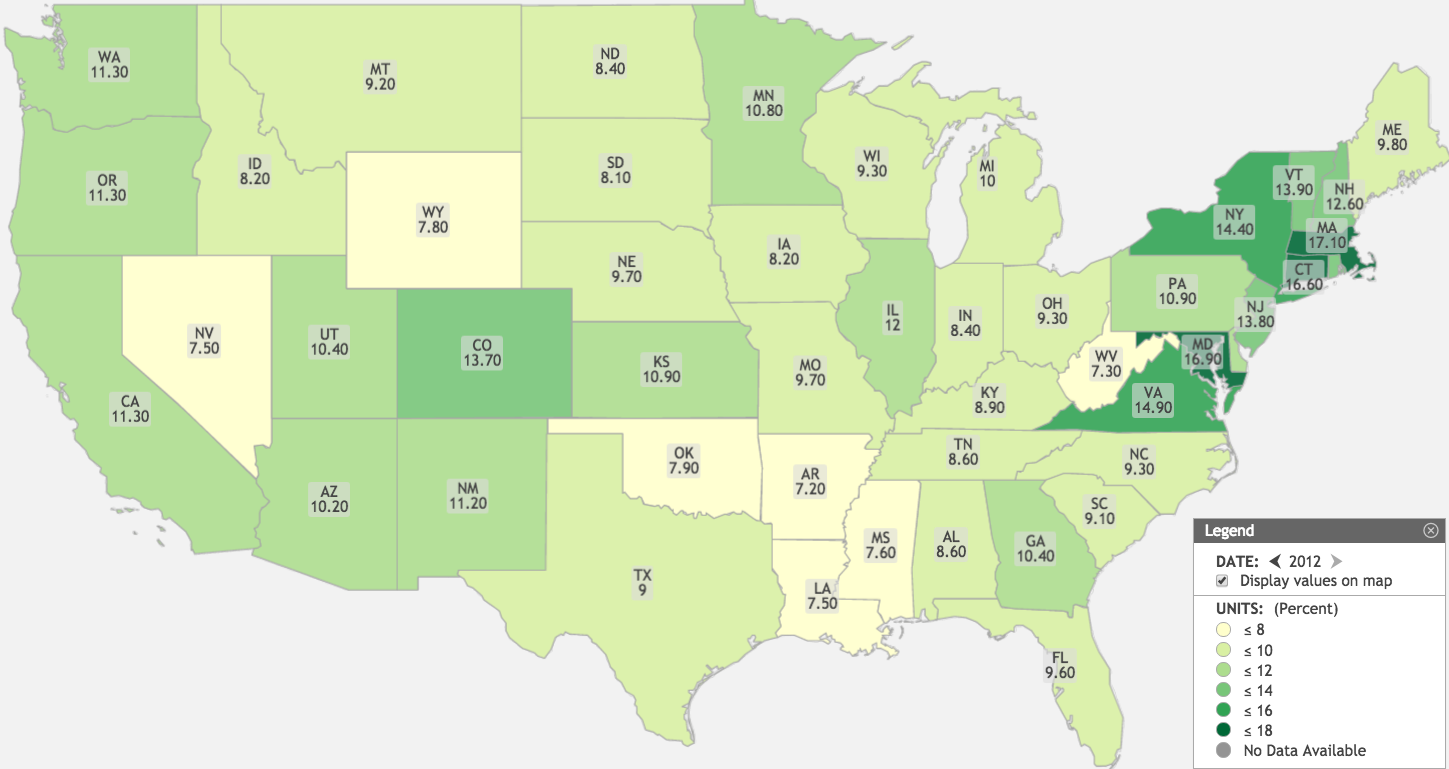
The image shows a map of the United States with the percentage of people living in each state.
Read full description
The image shows a map of the United States with the percentage of people living in each state. On the right side of the image, there is text that reads "United States Data Values Map". The map is divided into different colors, each representing a different state, and each color is labeled with the corresponding data values. The colors range from light blue to dark blue, with the lightest blue representing the highest values and the darkest blue representing lower values.