Public domain photos
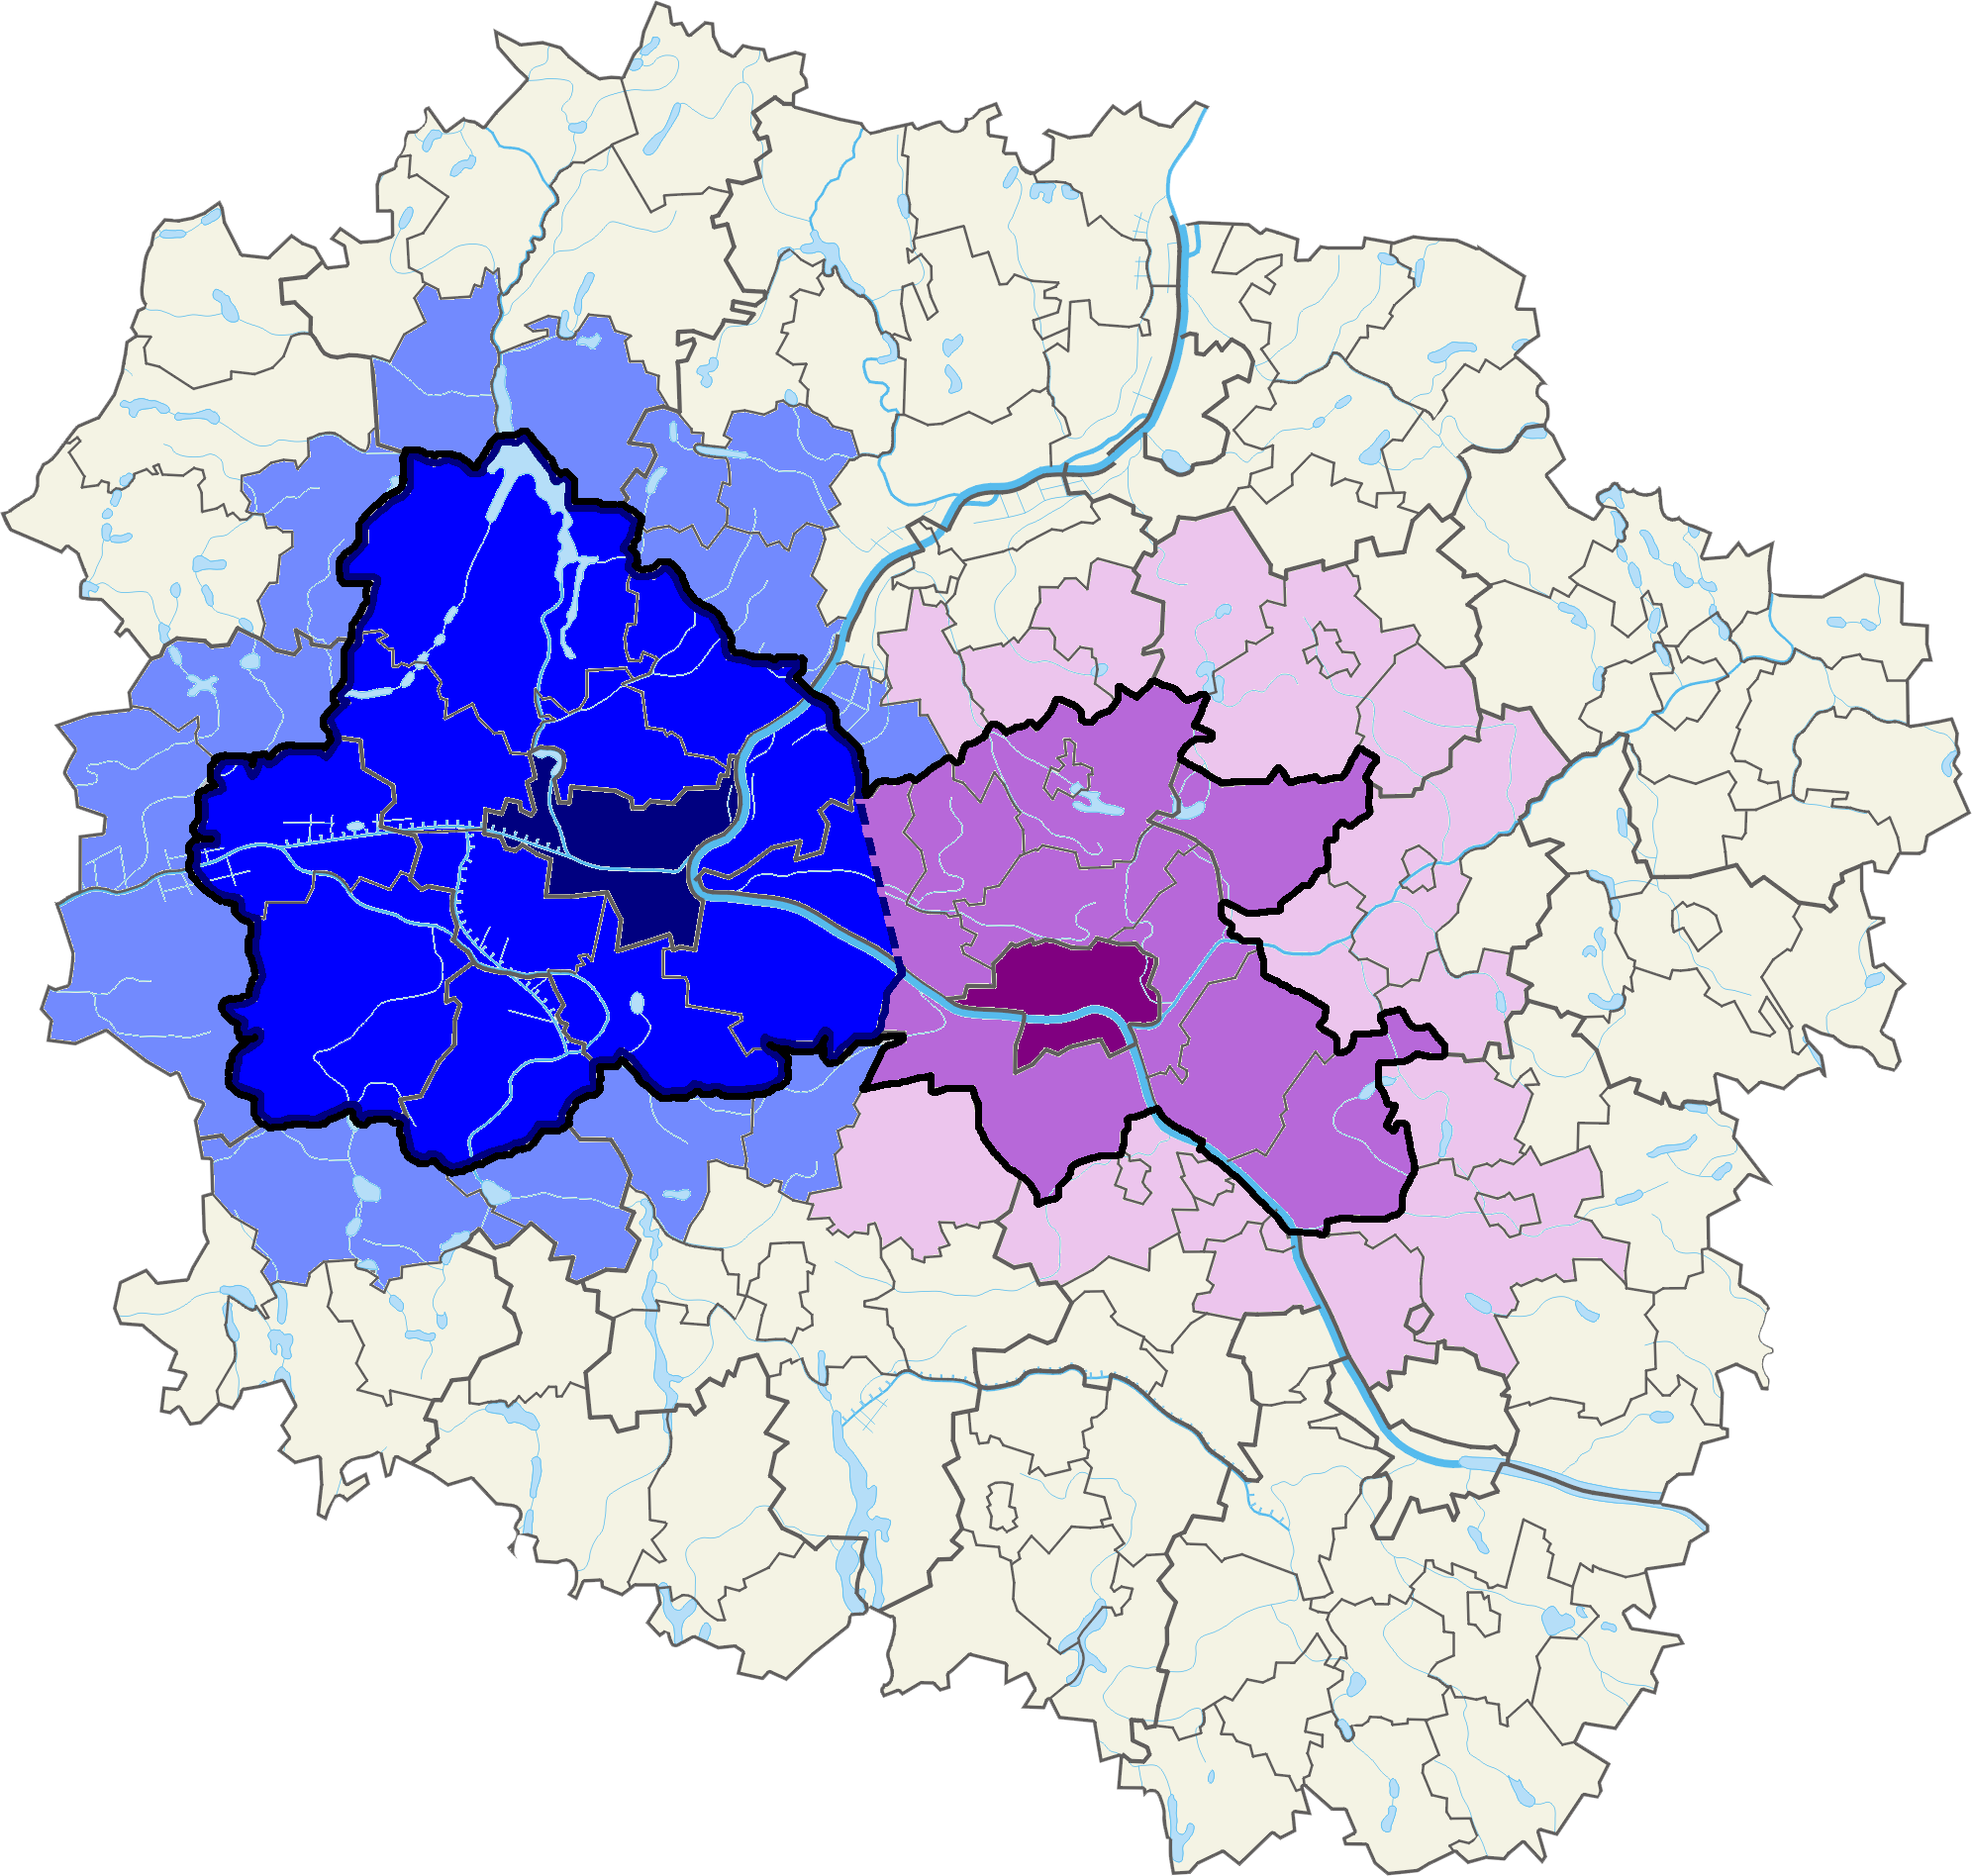
The image shows a map of London with different colors representing the percentage of people living in the city. The colors range from light blue to dark blue, with the darker blue representing the majority of the population. The map also shows the boundaries of the boroughs, with each borough represented by a different color.
 Open in library