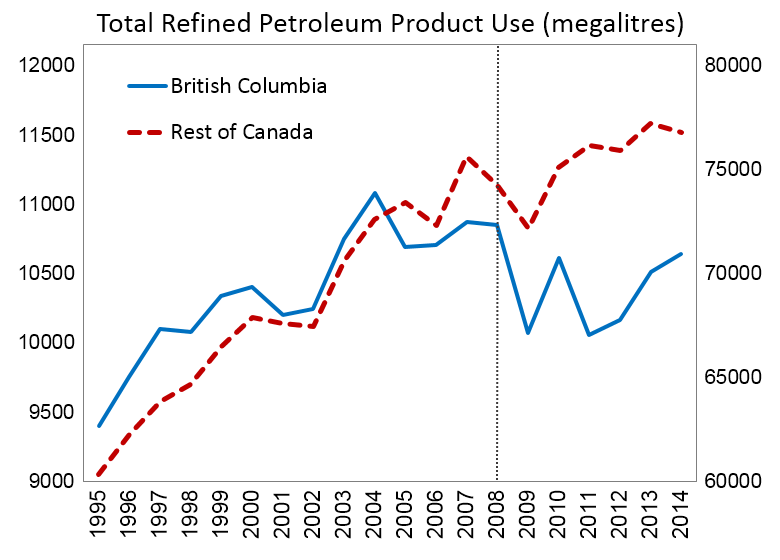
The image shows a graph on a white background with text that reads "Total Refined Petroleum Product Use Megalitres".
Read full description
The image shows a graph on a white background with text that reads "Total Refined Petroleum Product Use Megalitres". The graph is composed of two lines, one in blue and one in red, that represent the total refined petroleum product use. The blue line is steadily increasing, while the red line is decreasing. The text is written in a bold font and is centered on the graph.