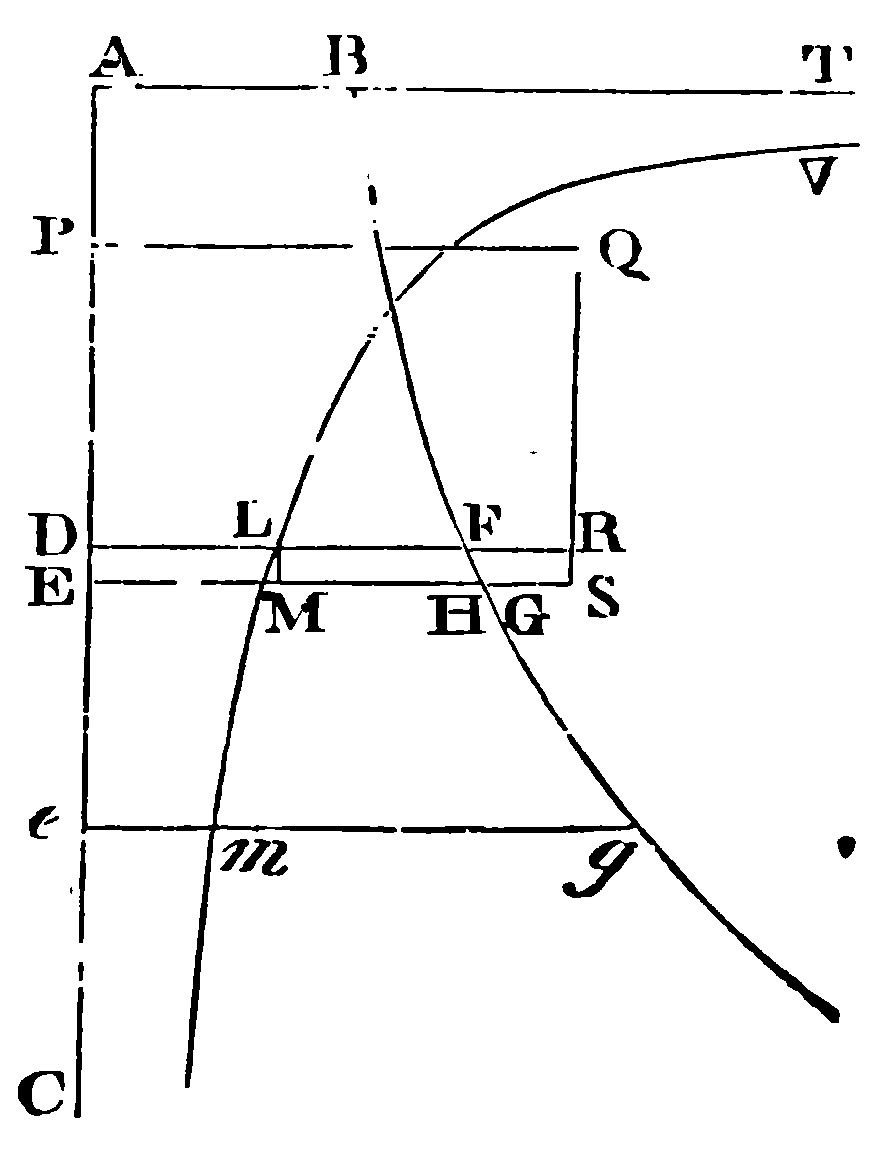
The image shows a black and white diagram of a curve with a point at the end of it, which is a representation of the demand curve.
Read full description
The image shows a black and white diagram of a curve with a point at the end of it, which is a representation of the demand curve. The text accompanying the diagram provides further details about the curve, such as its length, width, and height.