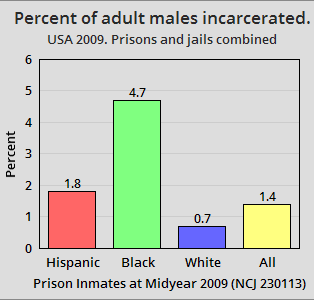
The image shows a screen with a bar chart depicting the percentage of adult males incarcerated in the United States.
Read full description
The image shows a screen with a bar chart depicting the percentage of adult males incarcerated in the United States. The chart is composed of several bars of varying heights, each representing a different age group, with the height of each bar indicating the percentage. The text on the screen provides further information about the data being presented.