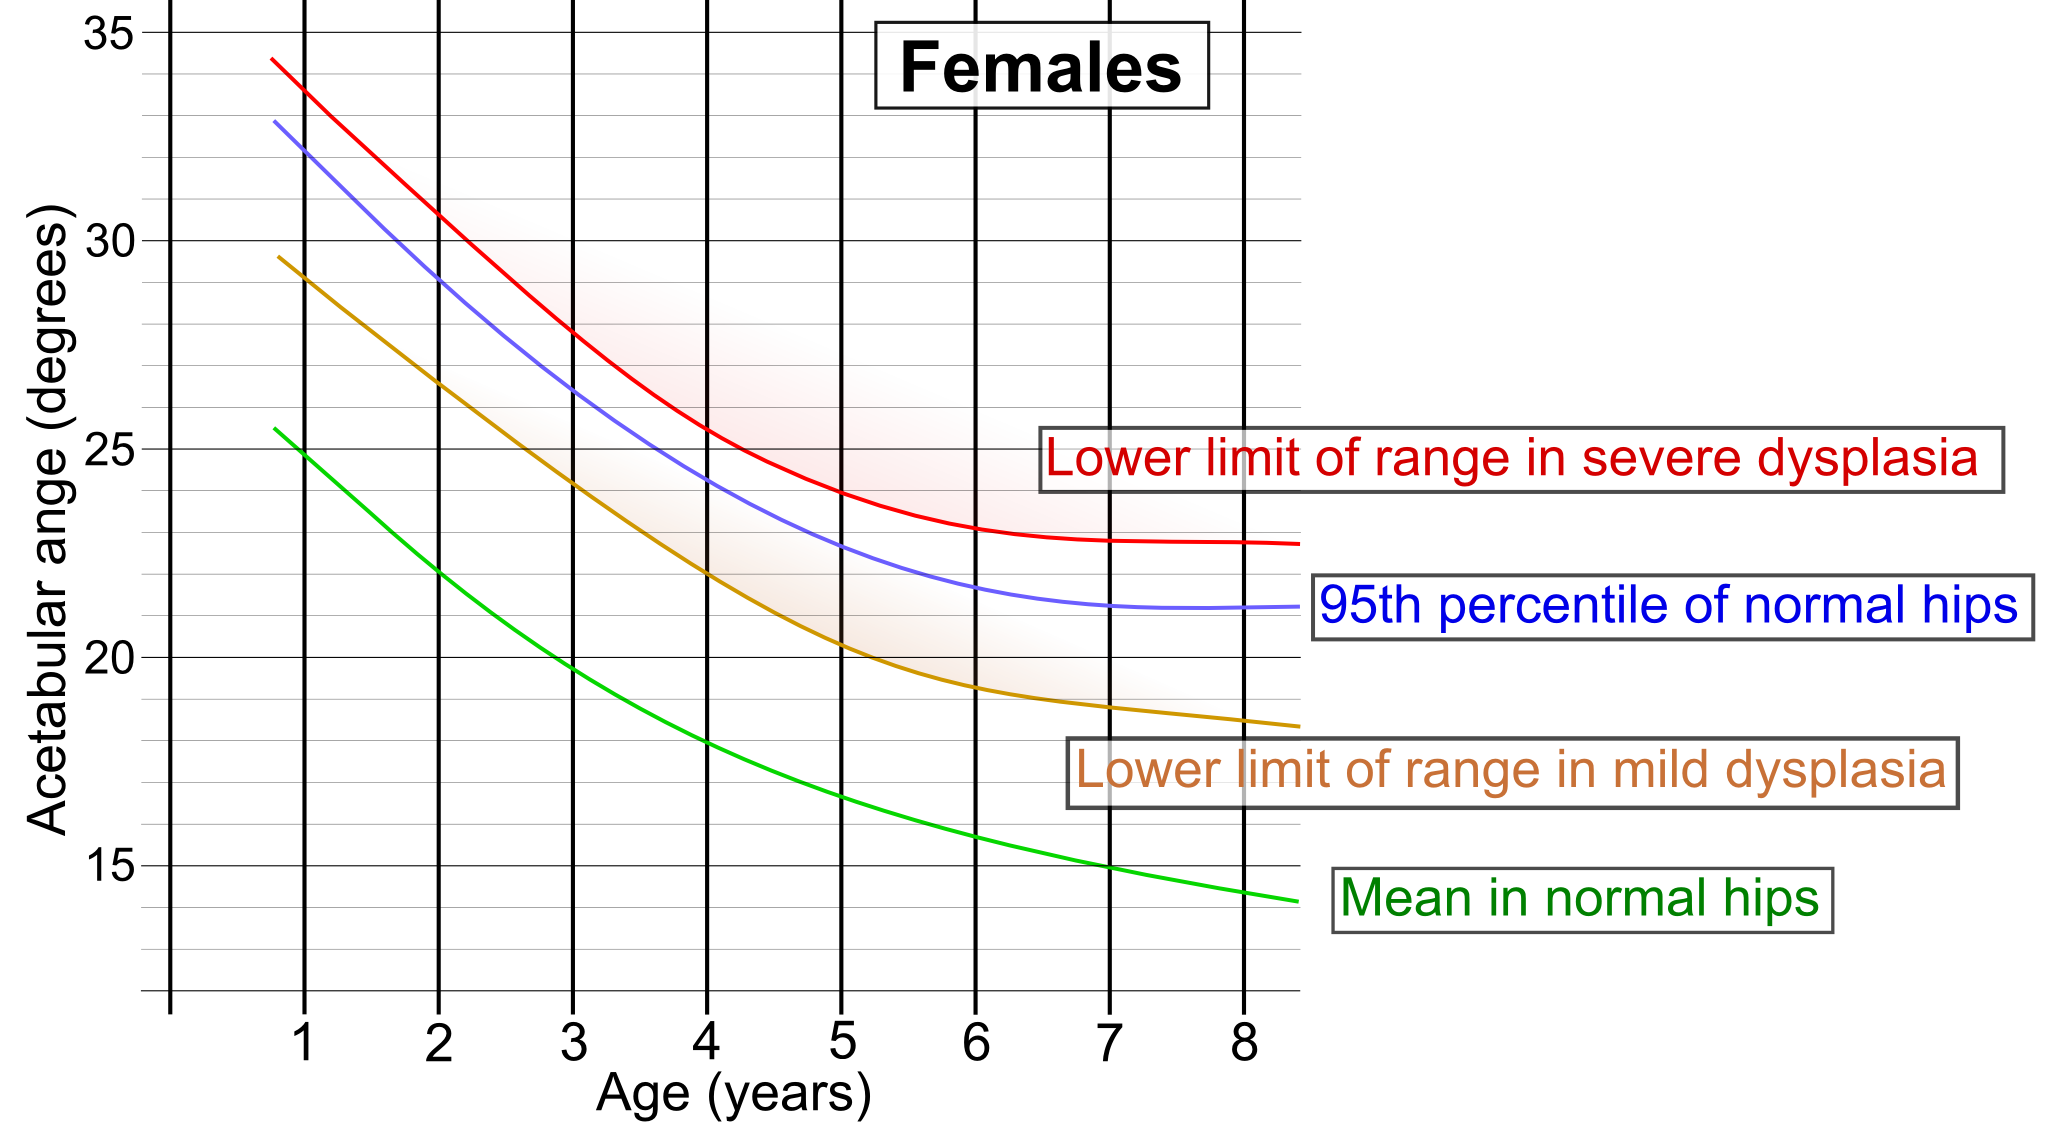
The image shows a graph depicting the correlation between the number of females and the percentage of males in the human body.
Read full description
The image shows a graph depicting the correlation between the number of females and the percentage of males in the human body. The graph is divided into two sections, one for males and one for females, and each section is further divided into different colors, each representing a different age group. The colors range from light blue to dark blue, with the darker blue representing the highest age group and the lighter blue representing lower age groups. The text on the graph provides further information about the differences between the two groups.