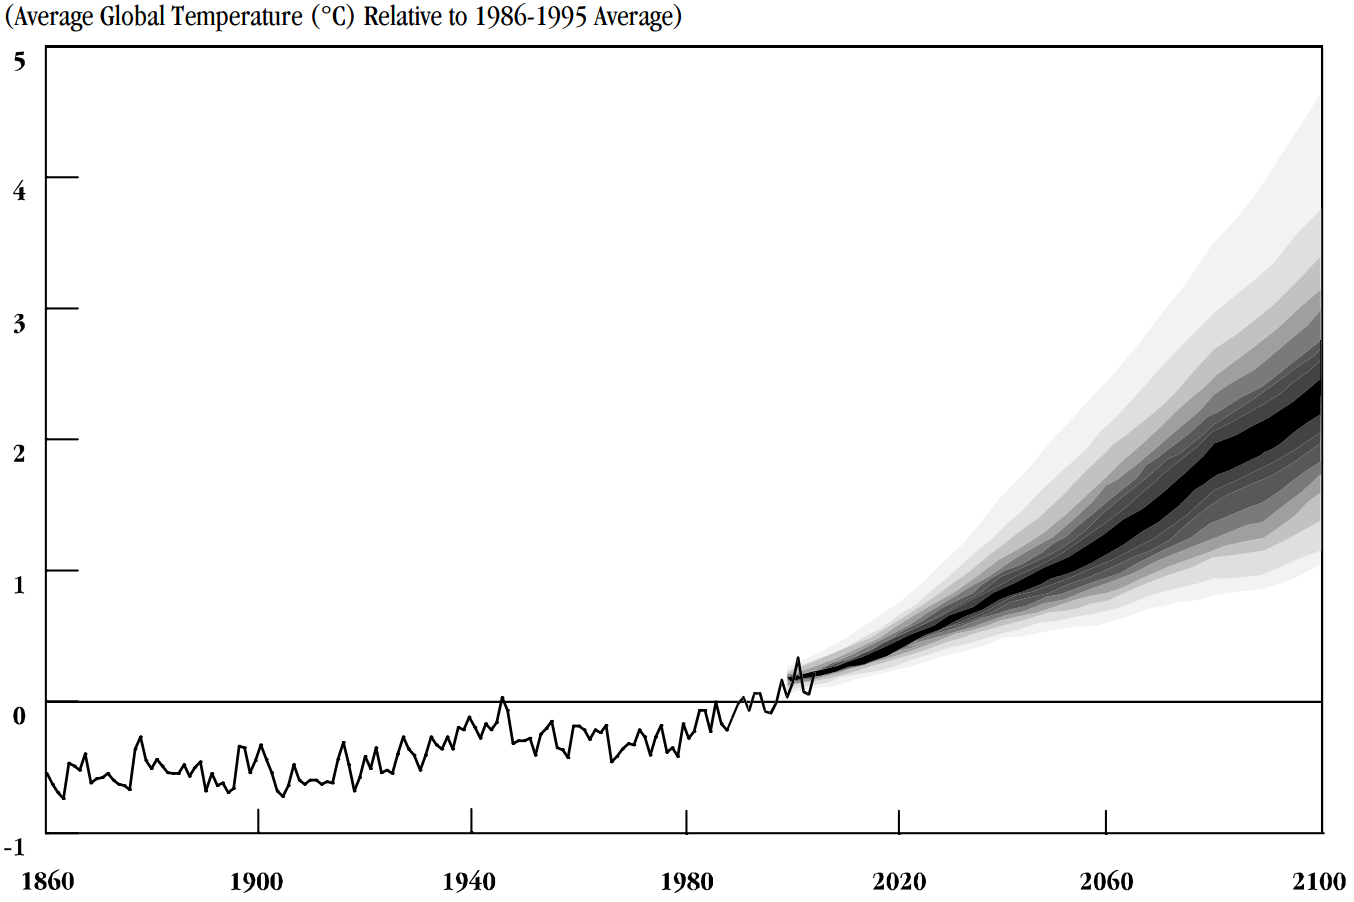
The image shows a graph depicting the average global temperature relative to the average temperature in the United States.
Read full description
The image shows a graph depicting the average global temperature relative to the average temperature in the United States. The graph is composed of a series of points connected by a line, with the x-axis representing the temperature and the y-axis indicating the relative temperature. The points are labeled with the years from 1900 to 2020, indicating that the graph is meant to illustrate the relationship between the temperature over time.