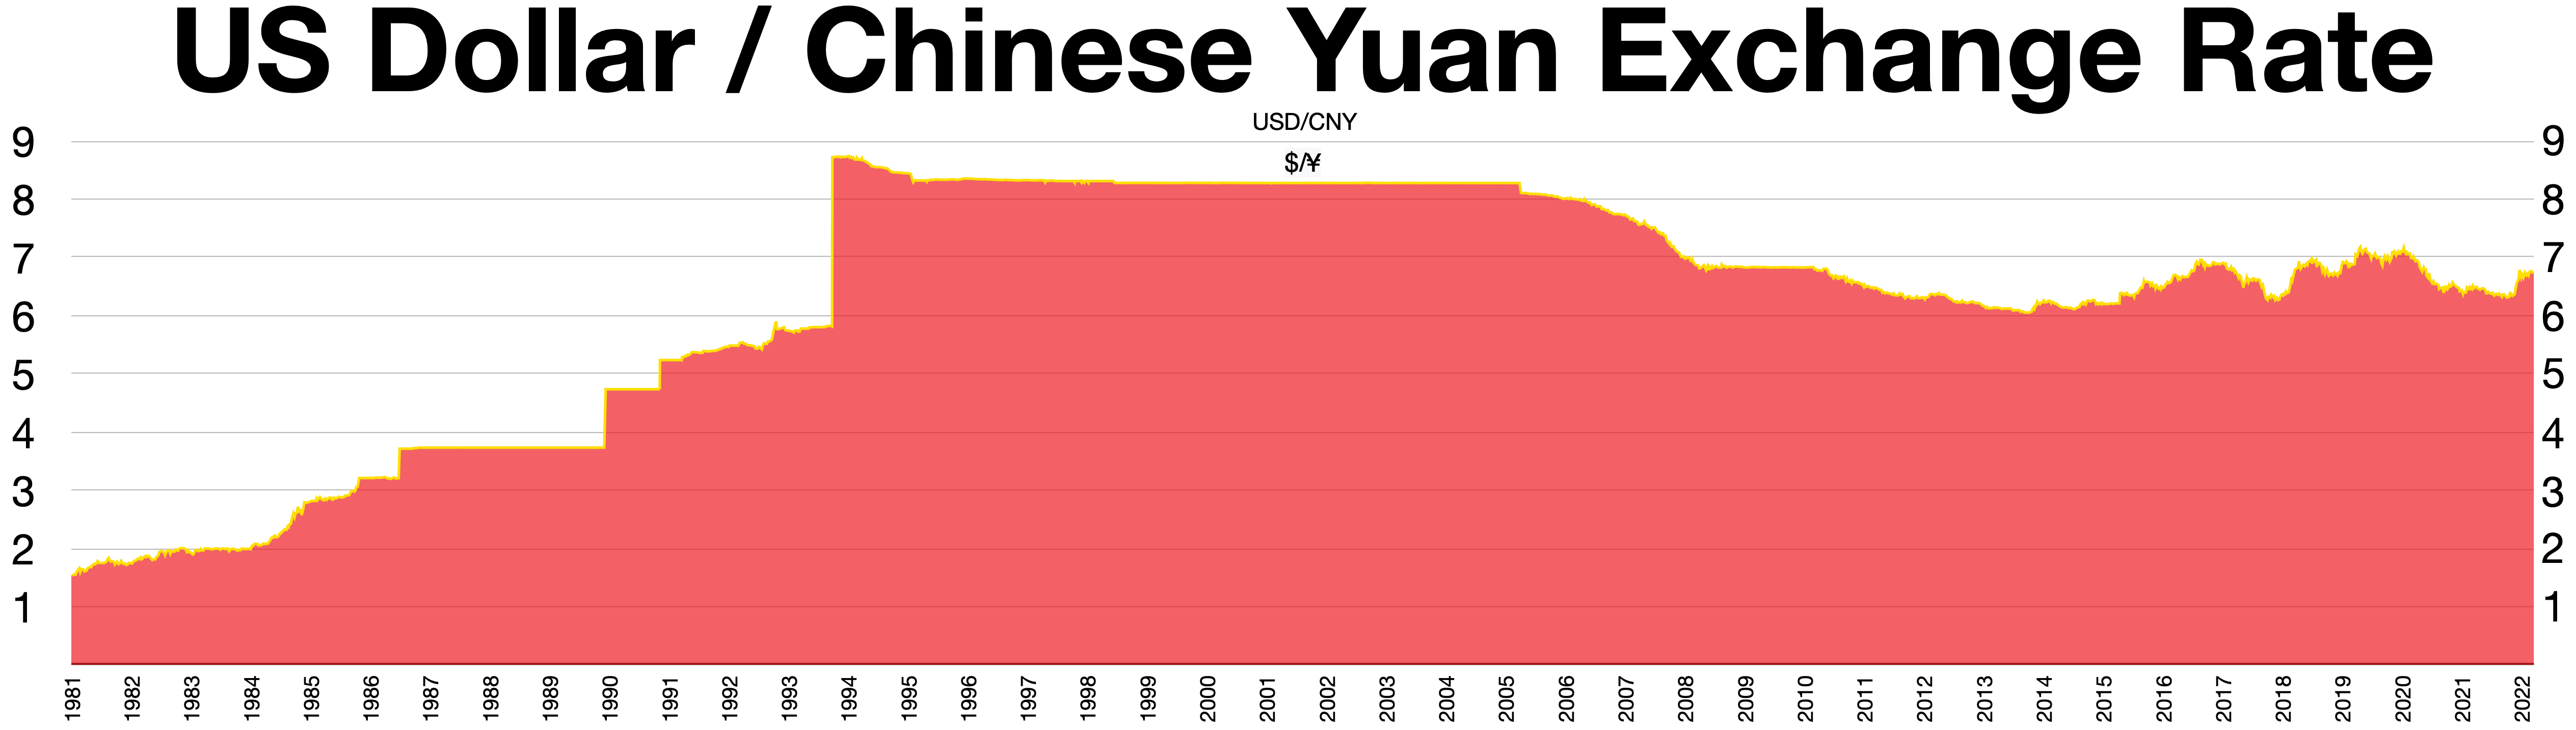
The image shows a graph of the US Dollar/Chinese Yuan exchange rate.
Read full description
The image shows a graph of the US Dollar/Chinese Yuan exchange rate. The graph is composed of a series of points connected by a line, with the x-axis representing the exchange rate and the y-axis indicating the time period. The points on the graph represent the exchange rates between the two currencies, with each point representing a different exchange rate over a period of time.