Public domain photos
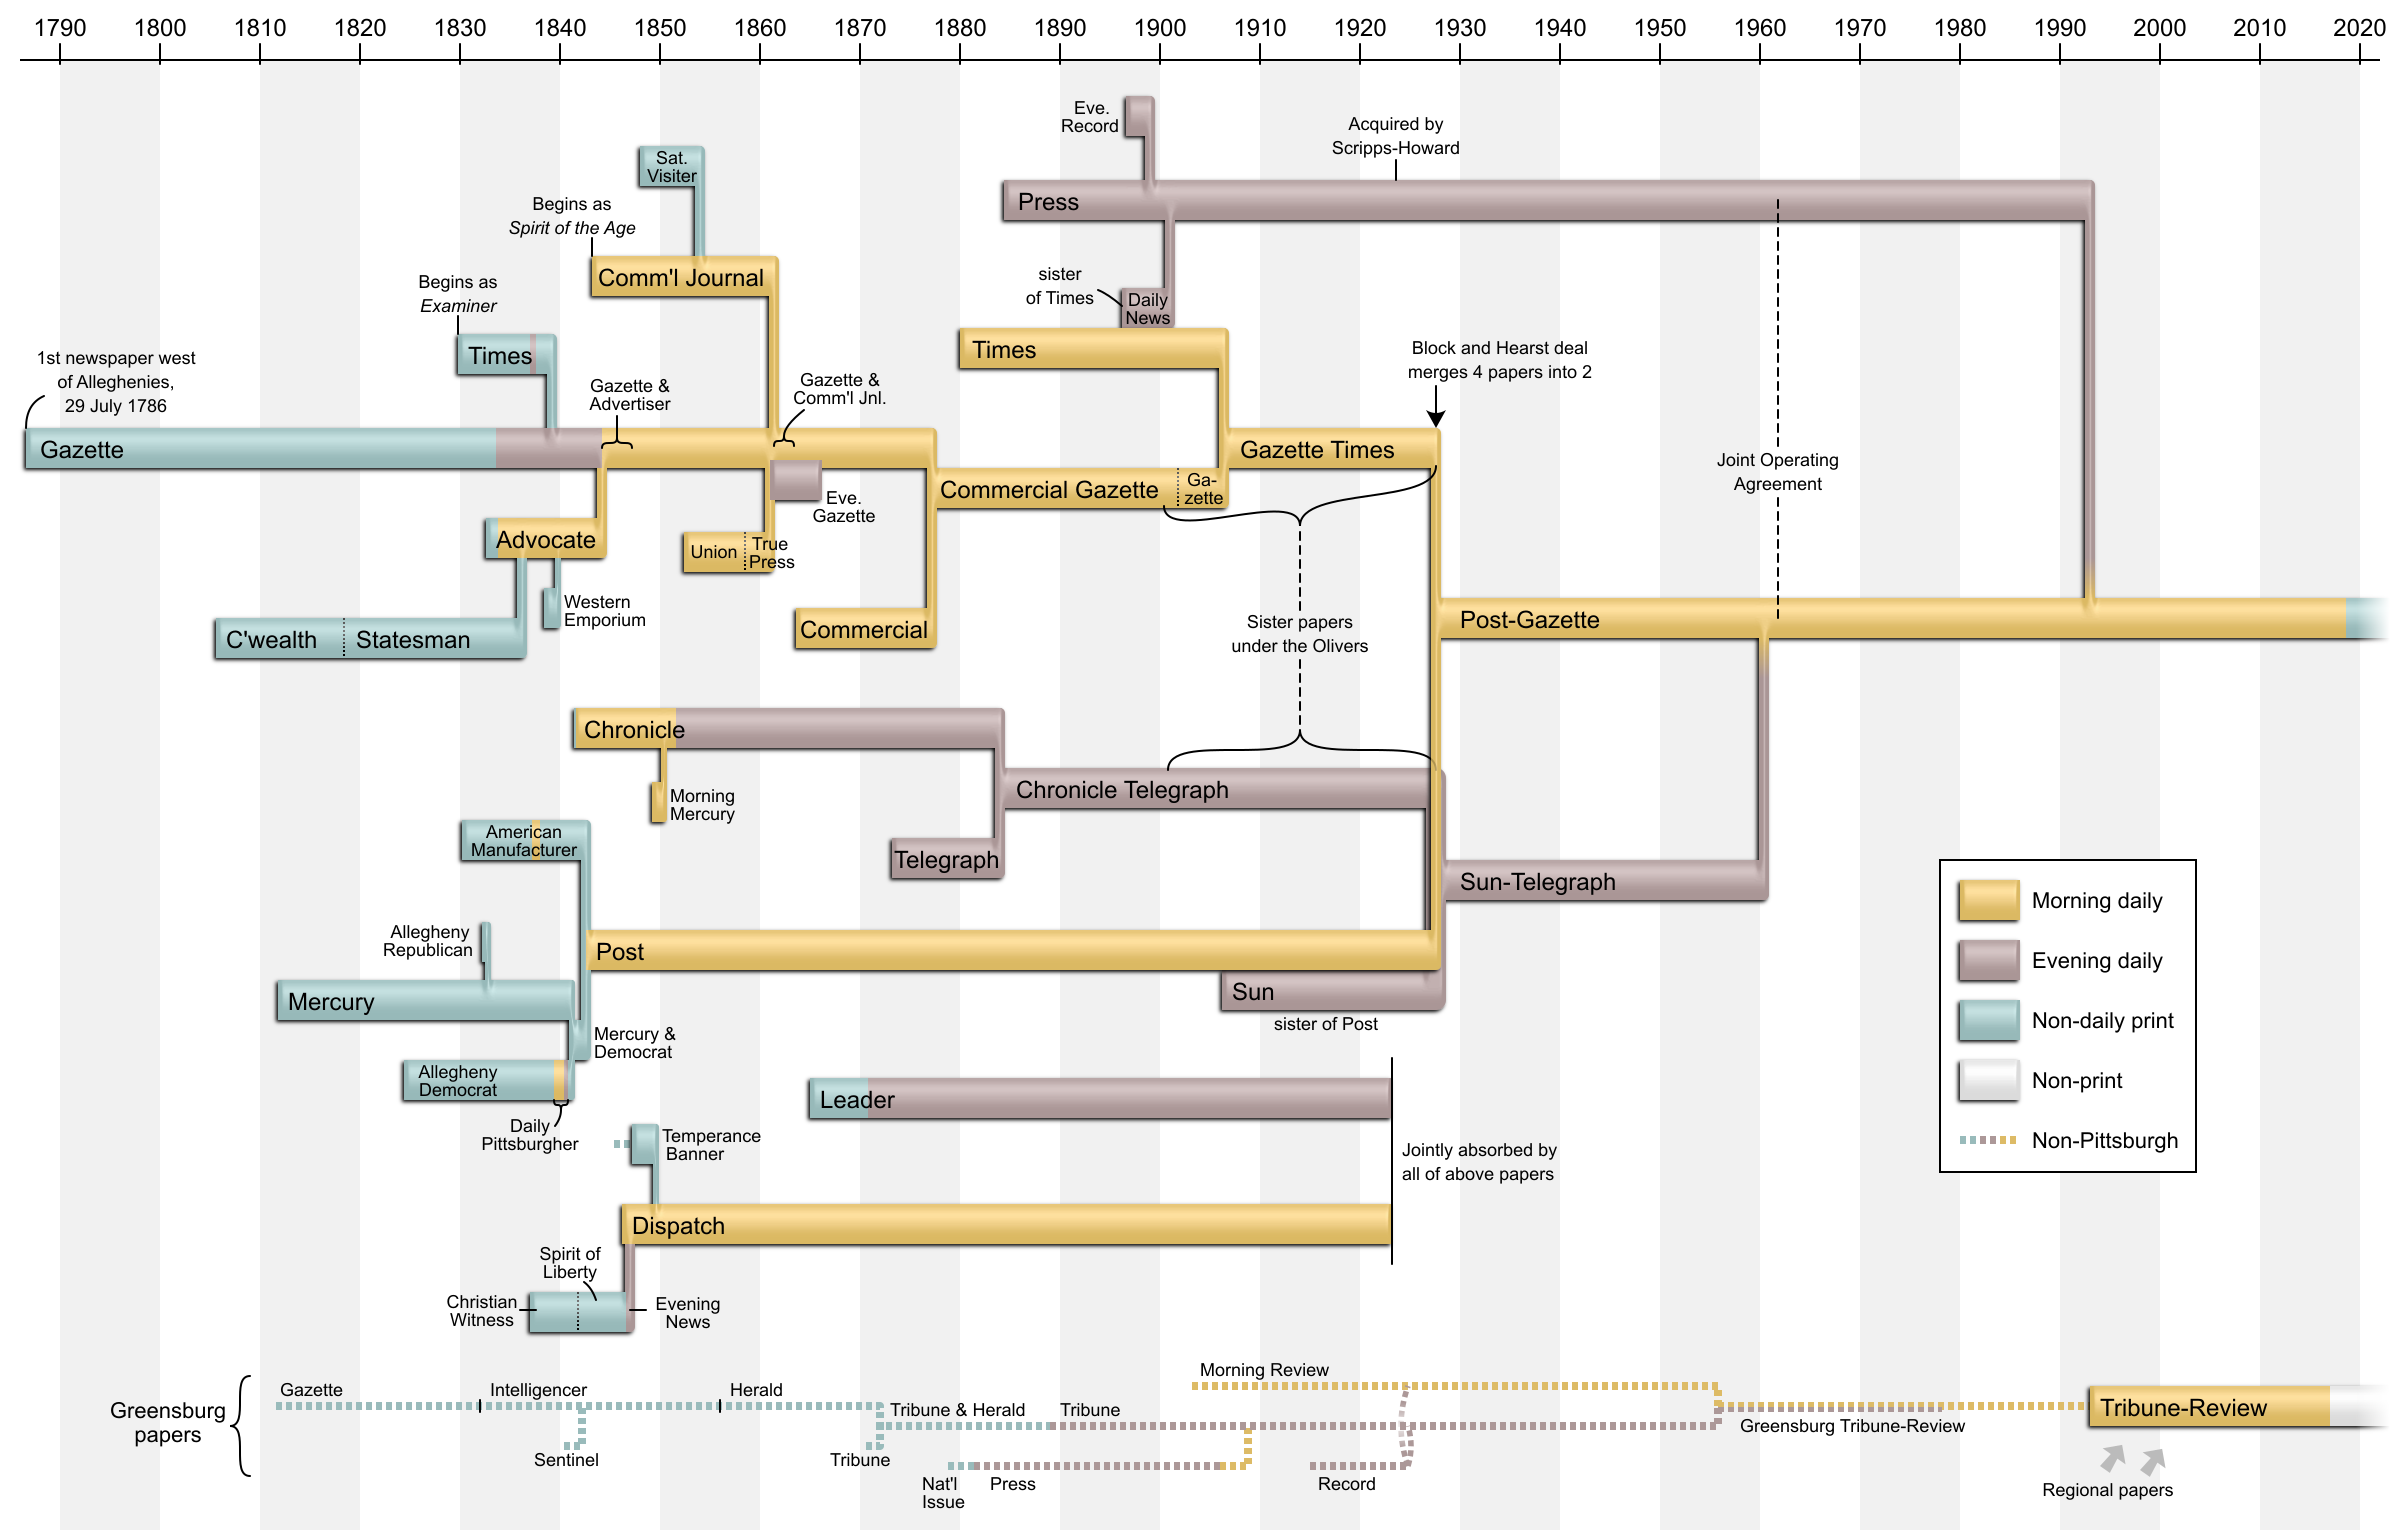
The image shows a Gantt chart template for Microsoft Office 365, which is a graphical representation of a timeline chart with text labels indicating the different stages of a business process. It is a useful tool for organizing and tracking the progress of a project, with each stage represented by a different color and labeled with a description of the task at hand. The chart also includes arrows connecting the different sections of the chart, indicating the order in which the tasks should be completed.
 Open in library