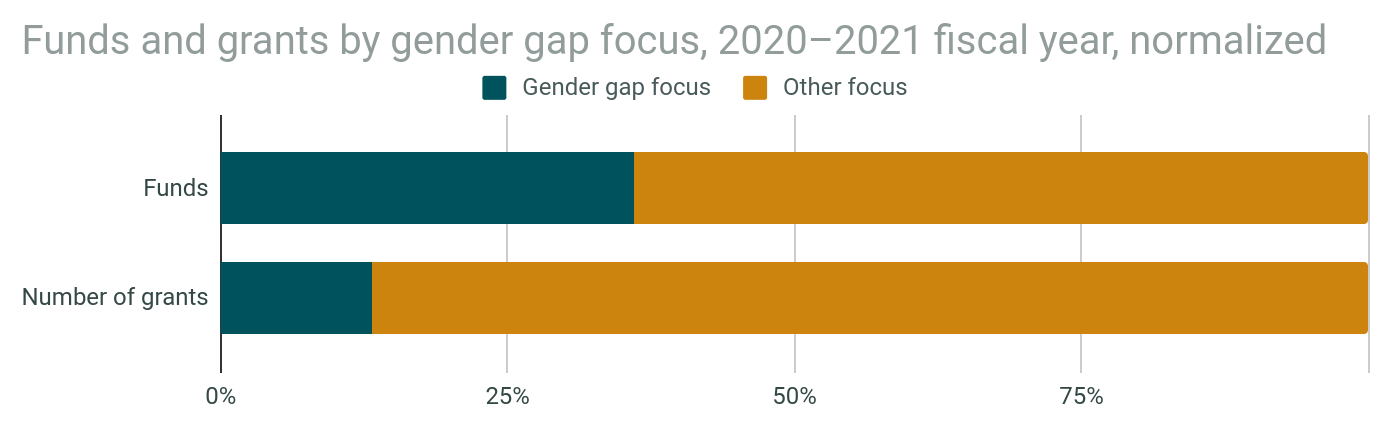
The image shows a bar chart depicting the gender gap focus of funds and grants by gender in 2020-2021, with the fiscal year normalized.
Read full description
The image shows a bar chart depicting the gender gap focus of funds and grants by gender in 2020-2021, with the fiscal year normalized. The chart is divided into two sections, one for funds and one for grants, and each section is further divided into percentages. The text on the chart provides further information about the data.