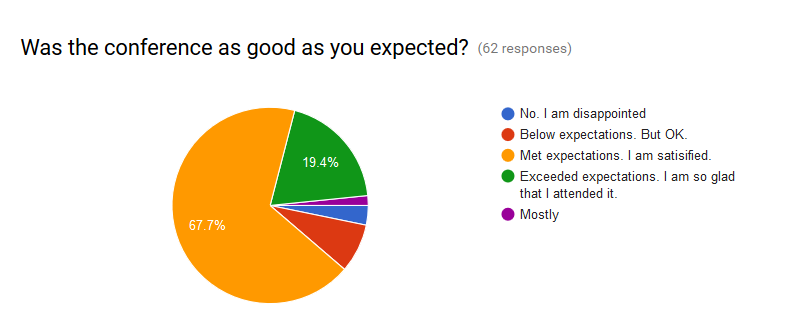
The image shows a pie chart with the words "Was the conference as good as you expected?" in the center.
Read full description
The image shows a pie chart with the words "Was the conference as good as you expected?" in the center. The chart is divided into several sections, each representing a different aspect of the conference, such as the number of attendees, the percentage of attendees who attended the conference. The colors of the sections vary, with some being blue, green, yellow, and red. The text is written in a bold font, emphasizing the importance of the message.