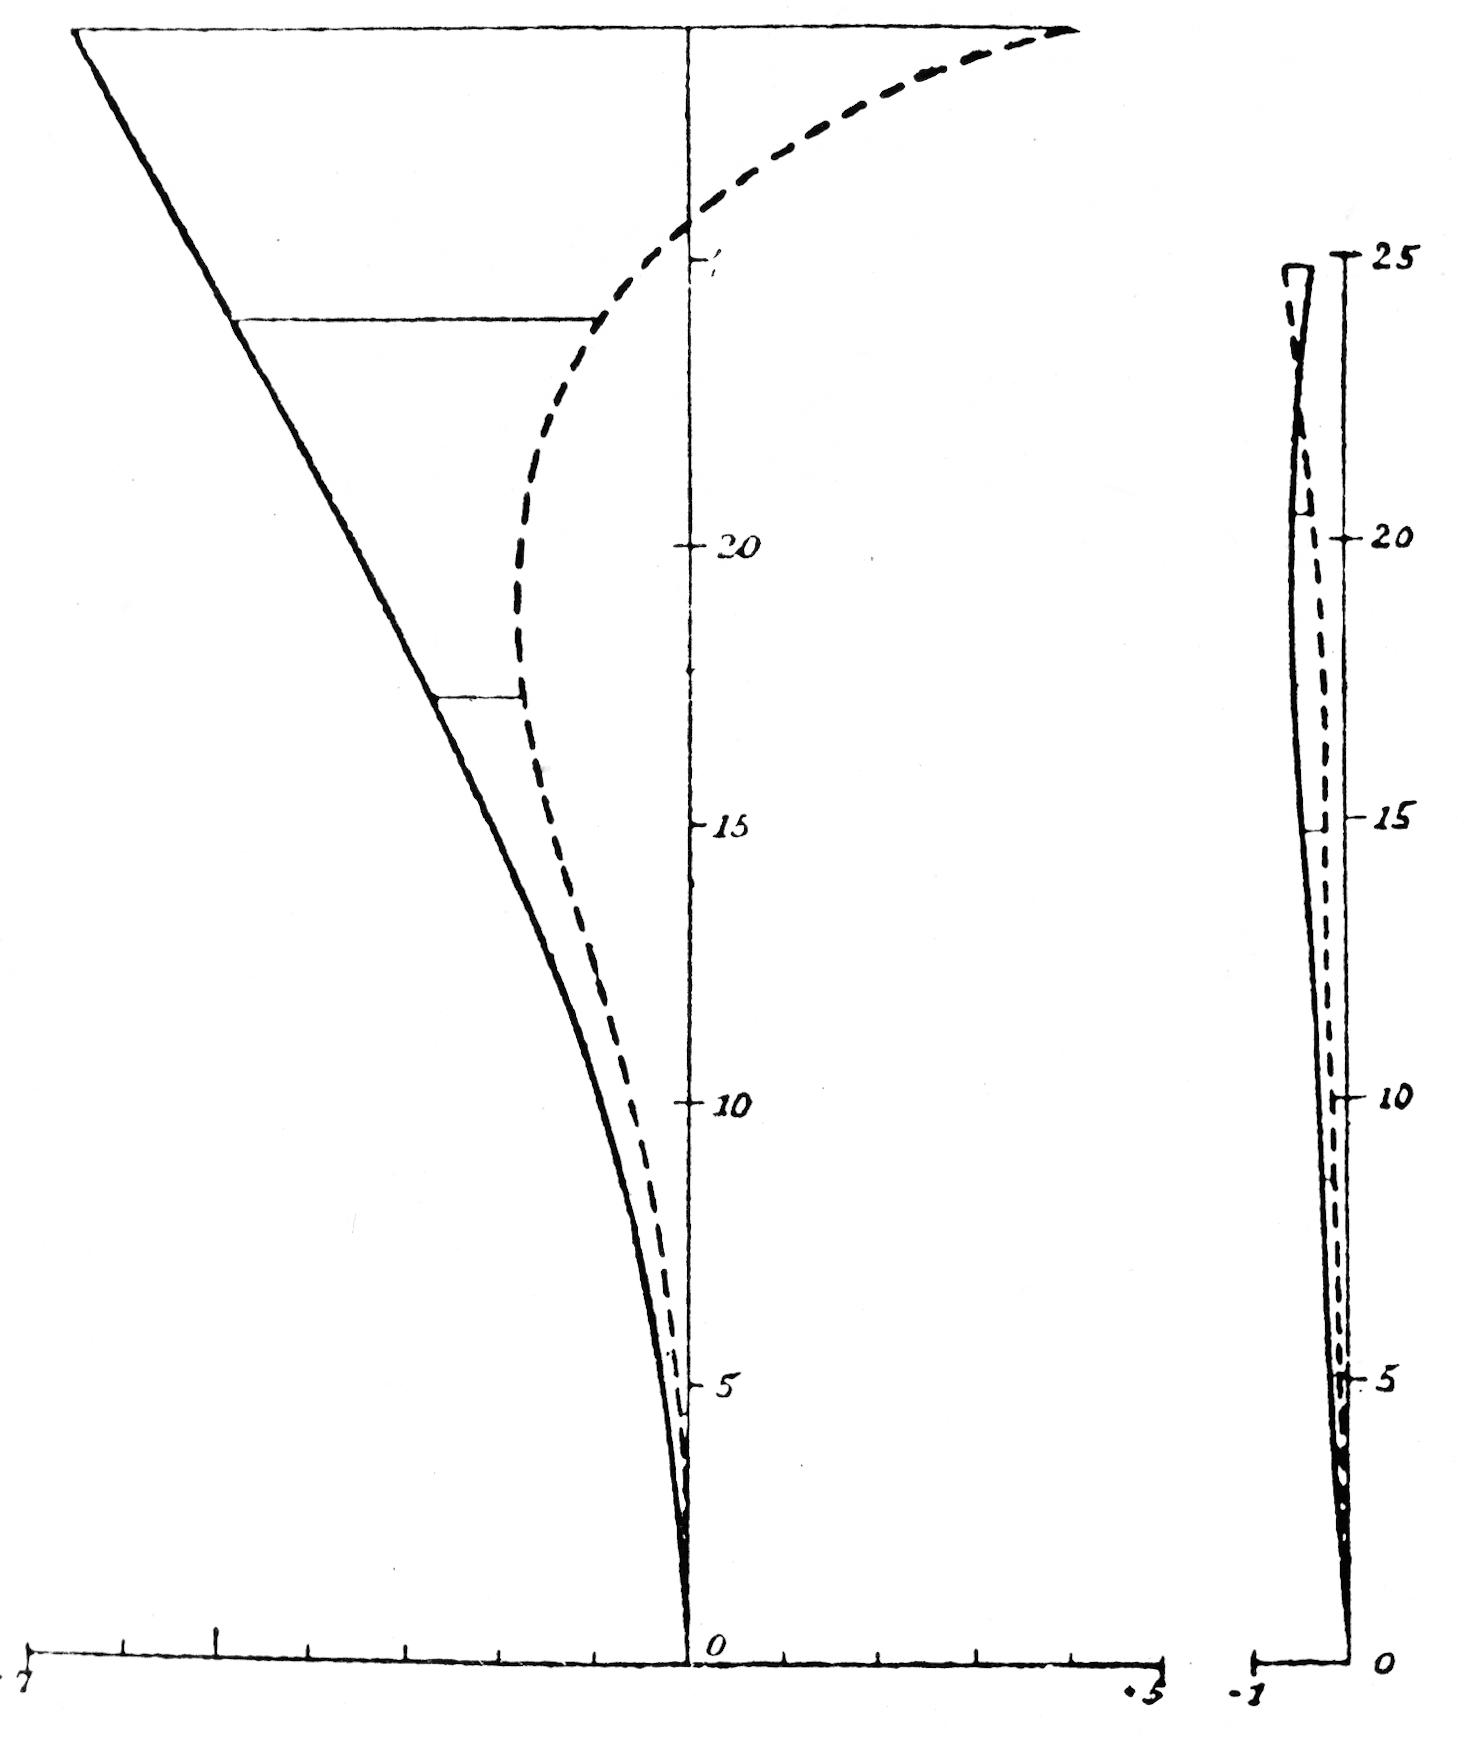
The image shows a diagram of a curved line with a curve at the bottom and a line graph at the top.
Read full description
The image shows a diagram of a curved line with a curve at the bottom and a line graph at the top. The text on the paper reads "Figure 1 for the distribution of the volume of a single-phase reactor". The diagram is composed of a series of points connected by a line, with the x-axis representing the volume and the y-axis indicating the volume. The line graph shows the relationship between the two variables, with each point representing a different phase of the reactor.