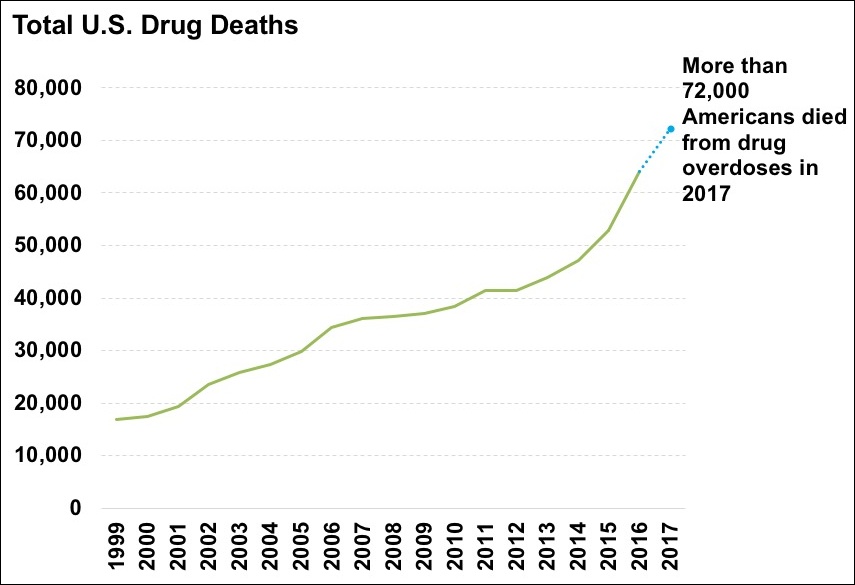
The image shows a graph on a white background with text that reads "Total U.S.
Read full description
The image shows a graph on a white background with text that reads "Total U.S. Drug Deaths". The graph displays the number of deaths in the United States over a period of time, with the x-axis representing the years and the y-axis indicating the amount of deaths. The graph is divided into sections, each representing a different year, and the height of each section indicates the total number of fatalities.