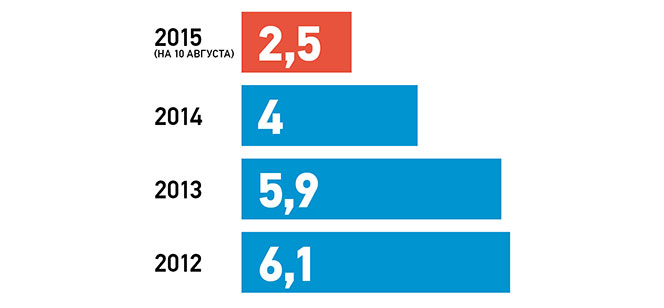
The image shows a bar chart depicting the number of people who have been diagnosed with cancer in Ukraine.
Read full description
The image shows a bar chart depicting the number of people who have been diagnosed with cancer in Ukraine. The chart is divided into four sections, each representing a different year, and each section is labeled with the corresponding year. The colors of the sections range from light blue to dark blue, with the lightest blue representing the most recent year.