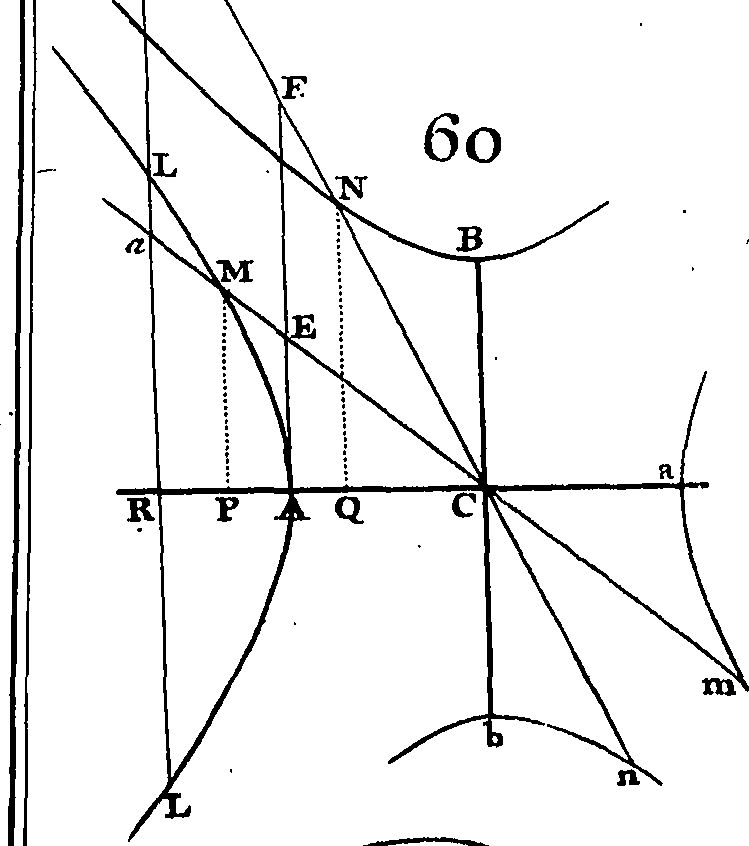
The image shows a diagram of a supply and demand curve, with a white background and text written on it.
Read full description
The image shows a diagram of a supply and demand curve, with a white background and text written on it. The diagram illustrates the relationship between the two variables, with the supply curve at the top and the demand curve at a lower point. The text provides further explanation of the diagram, providing further details about the relationship.