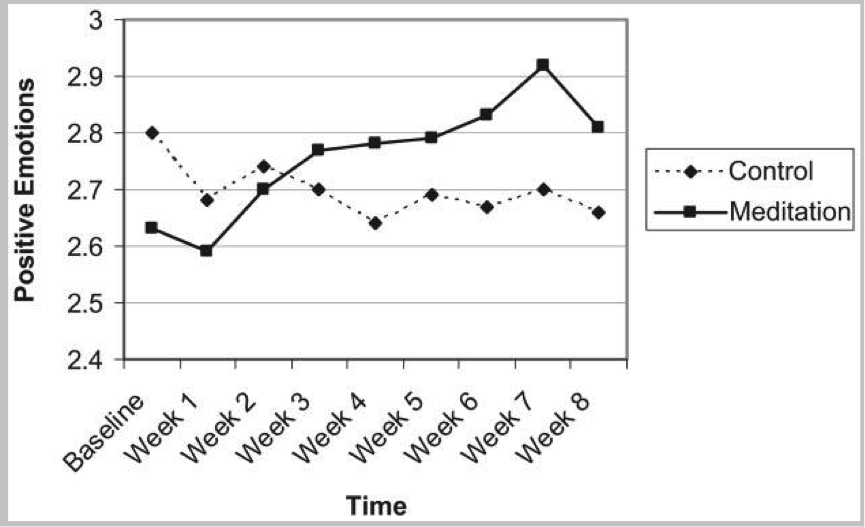
The image shows a line graph depicting the correlation between positive emotions and control and meditation.
Read full description
The image shows a line graph depicting the correlation between positive emotions and control and meditation. The graph is composed of two lines, one representing positive emotions, and the other representing meditation. Both lines are plotted on a white background, with the positive emotions line on the left and the meditation line in the middle. The positive emotions are represented by a series of points connected by a line, while the time line is represented by an arrow pointing to the right. The text on the graph provides further information about the data.