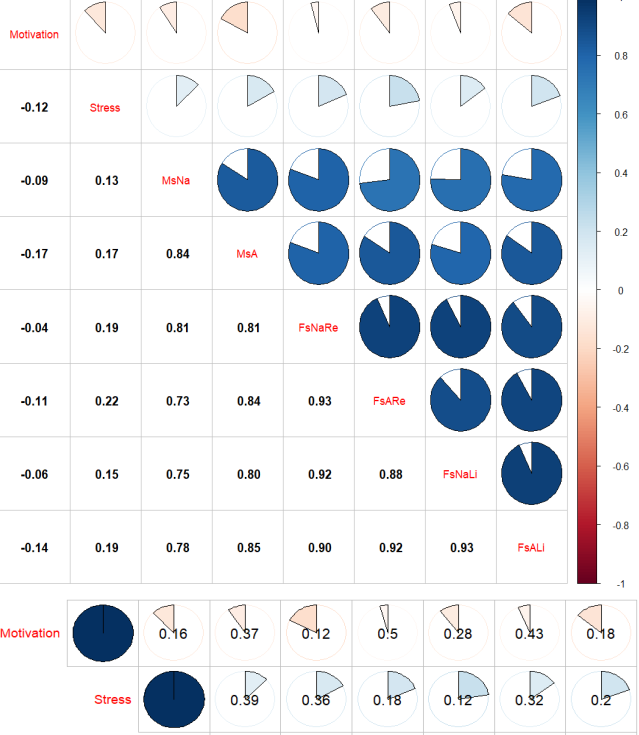
The image shows a screenshot of a dashboard with a pie chart and a bar chart, which is a visual representation of the results of a study.
Read full description
The image shows a screenshot of a dashboard with a pie chart and a bar chart, which is a visual representation of the results of a study. The chart is divided into sections, each representing a different statistic, such as the number of people who have been diagnosed with cancer, the percentage of patients who have experienced cancer, and the average number of deaths. The bar chart is labeled with the names of the different statistics, and it is accompanied by a legend that explains the meaning of each statistic.