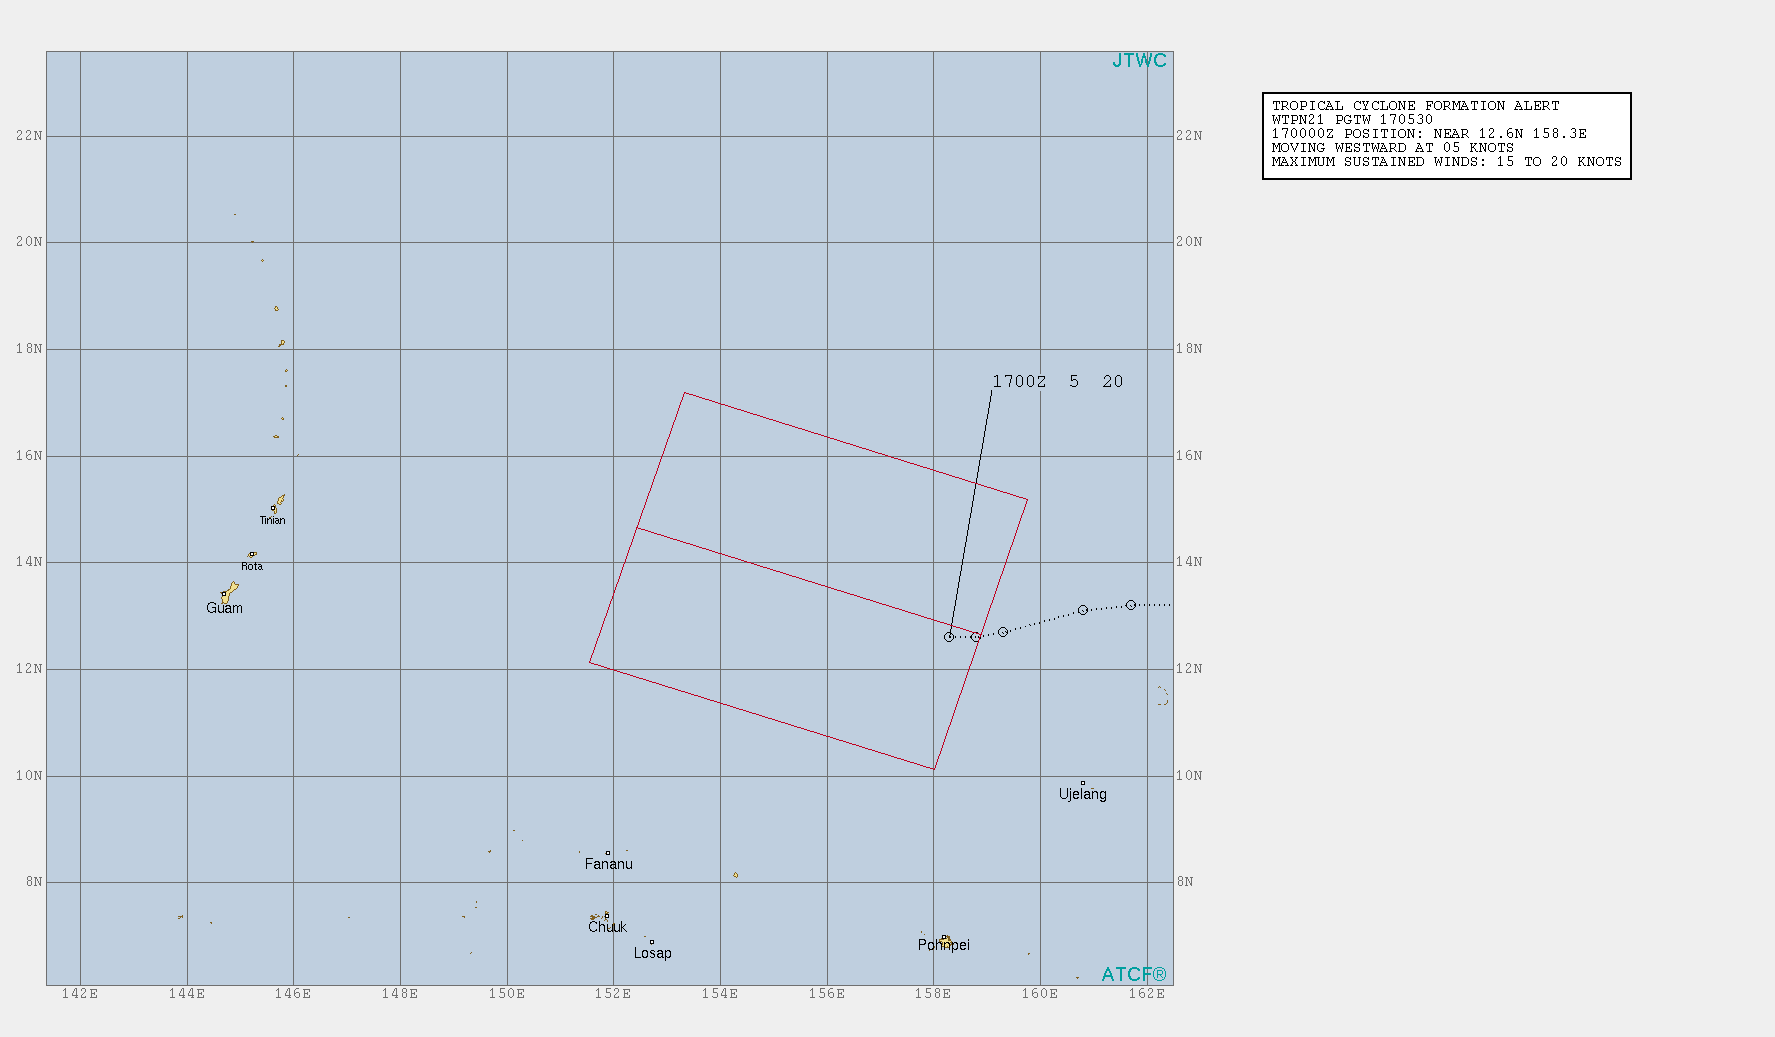
The image shows a computer screen with a graph of a square with a red line in the middle of it, surrounded by text and numbers.
Read full description
The image shows a computer screen with a graph of a square with a red line in the middle of it, surrounded by text and numbers. The graph appears to be a coordinate system, with the x-axis representing the time and the y-axis indicating the distance between the two points. The red line is likely used to indicate the coordinates of the coordinates, while the text provides additional information about the data being presented.